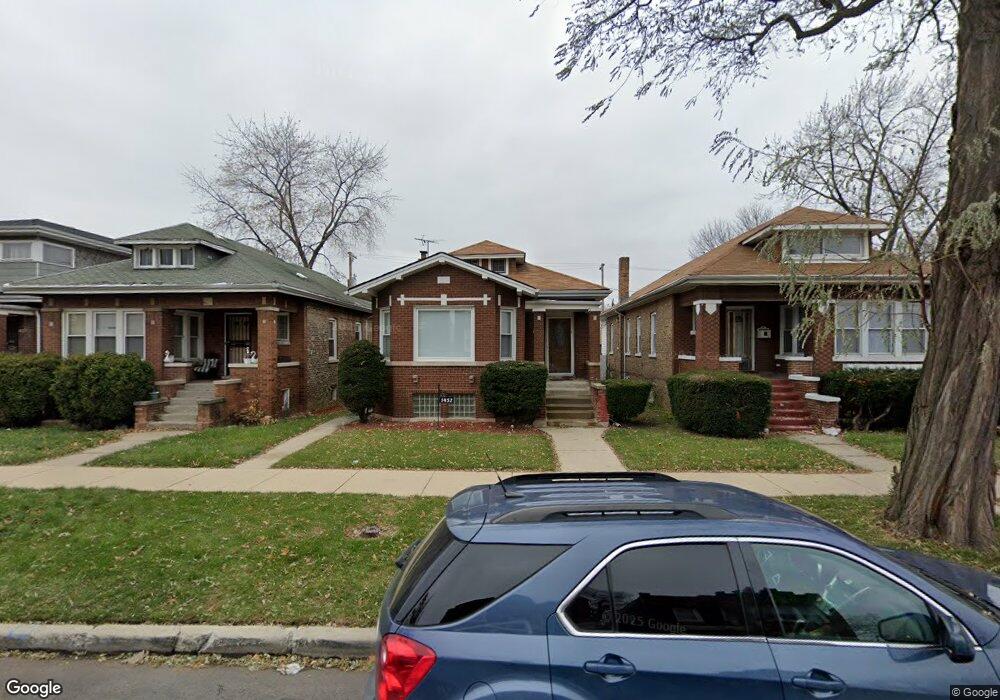
1452 N Massasoit Ave Chicago, IL 60651
Austin NeighborhoodEstimated Value: $252,000 - $314,000
3
Beds
2
Baths
1,247
Sq Ft
$223/Sq Ft
Est. Value
About This Home
This home is located at 1452 N Massasoit Ave, Chicago, IL 60651 and is currently estimated at $278,358, approximately $223 per square foot. 1452 N Massasoit Ave is a home located in Cook County with nearby schools including Ella Flagg Young School, CICS West Belden, and St Angela Elementary School.
Ownership History
Date
Name
Owned For
Owner Type
Purchase Details
Closed on
Aug 31, 2015
Sold by
Ewing Freddie L
Bought by
Ellis Garnetta A
Current Estimated Value
Home Financials for this Owner
Home Financials are based on the most recent Mortgage that was taken out on this home.
Original Mortgage
$154,965
Outstanding Balance
$124,817
Interest Rate
5%
Mortgage Type
FHA
Estimated Equity
$153,541
Purchase Details
Closed on
Dec 26, 2000
Sold by
Beal Linda
Bought by
Ewing Freddie L and Ewing Mildred L
Home Financials for this Owner
Home Financials are based on the most recent Mortgage that was taken out on this home.
Original Mortgage
$134,700
Interest Rate
13.25%
Purchase Details
Closed on
Jan 22, 1999
Sold by
Beal James and Beal Linda D
Bought by
Beal Linda D
Home Financials for this Owner
Home Financials are based on the most recent Mortgage that was taken out on this home.
Original Mortgage
$114,811
Interest Rate
6.83%
Create a Home Valuation Report for This Property
The Home Valuation Report is an in-depth analysis detailing your home's value as well as a comparison with similar homes in the area
Home Values in the Area
Average Home Value in this Area
Purchase History
| Date | Buyer | Sale Price | Title Company |
|---|---|---|---|
| Ellis Garnetta A | $80,000 | Attorneys Title Guaranty Fun | |
| Ewing Freddie L | $135,000 | Chicago Title Insurance Co | |
| Beal Linda D | -- | -- |
Source: Public Records
Mortgage History
| Date | Status | Borrower | Loan Amount |
|---|---|---|---|
| Open | Ellis Garnetta A | $154,965 | |
| Previous Owner | Ewing Freddie L | $134,700 | |
| Previous Owner | Beal Linda D | $114,811 |
Source: Public Records
Tax History
| Year | Tax Paid | Tax Assessment Tax Assessment Total Assessment is a certain percentage of the fair market value that is determined by local assessors to be the total taxable value of land and additions on the property. | Land | Improvement |
|---|---|---|---|---|
| 2025 | $3,520 | $21,000 | $5,115 | $15,885 |
| 2024 | $3,520 | $21,000 | $5,115 | $15,885 |
| 2023 | $3,410 | $20,000 | $4,092 | $15,908 |
| 2022 | $3,410 | $20,000 | $4,092 | $15,908 |
| 2021 | $3,352 | $20,000 | $4,092 | $15,908 |
| 2020 | $2,173 | $12,855 | $3,989 | $8,866 |
| 2019 | $2,870 | $14,284 | $3,989 | $10,295 |
| 2018 | $2,822 | $14,284 | $3,989 | $10,295 |
| 2017 | $2,659 | $12,351 | $3,478 | $8,873 |
| 2016 | $2,474 | $12,351 | $3,478 | $8,873 |
| 2015 | $2,263 | $12,351 | $3,478 | $8,873 |
| 2014 | $2,380 | $12,829 | $3,273 | $9,556 |
| 2013 | $2,333 | $12,829 | $3,273 | $9,556 |
Source: Public Records
Map
Nearby Homes
- 1418 N Waller Ave
- 1653 N Mason Ave
- 1512 N Linder Ave
- 1511 N Linder Ave
- 1647 N Austin Ave
- 5636 W Division St
- 1217 N Mason Ave
- 1711 N Austin Ave
- 1742 N Mayfield Ave
- 1400 N Lotus Ave
- 1640 N Linder Ave
- 1216 N Mason Ave
- 944 N Humphrey Ave
- 1132 N Waller Ave
- 1020 N Taylor Ave
- 1142 N Mason Ave
- 1627 N Lotus Ave
- 921 N Humphrey Ave
- 1038 Hayes Ave
- 1226 Hayes Ave
- 1456 N Massasoit Ave
- 1450 N Massasoit Ave
- 1446 N Massasoit Ave
- 1551 N Waller Ave
- 1444 N Massasoit Ave
- 1500 N Massasoit Ave
- 1440 N Massasoit Ave
- 1455 N Menard Ave
- 1457 N Menard Ave
- 1451 N Menard Ave
- 1447 N Menard Ave
- 1504 N Massasoit Ave
- 1455 N Massasoit Ave
- 1438 N Massasoit Ave
- 1459 N Massasoit Ave Unit 1
- 1445 N Menard Ave
- 1451 N Massasoit Ave
- 1451 N Massasoit Ave
- 1451 N Massasoit Ave Unit 2
- 1441 N Menard Ave
Your Personal Tour Guide
Ask me questions while you tour the home.