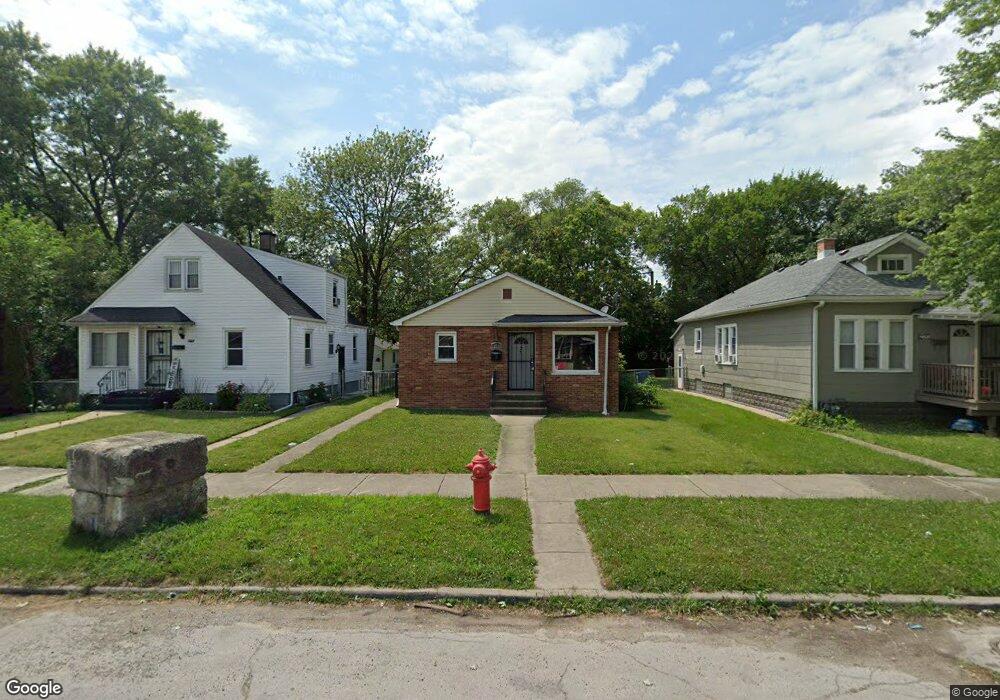
14524 Kentucky Ave Harvey, IL 60426
Estimated Value: $95,989 - $162,000
3
Beds
1
Bath
944
Sq Ft
$132/Sq Ft
Est. Value
About This Home
This home is located at 14524 Kentucky Ave, Harvey, IL 60426 and is currently estimated at $124,997, approximately $132 per square foot. 14524 Kentucky Ave is a home located in Cook County with nearby schools including Riley Early Childhood Center, Brooks Middle School, and Thornton Township High School.
Ownership History
Date
Name
Owned For
Owner Type
Purchase Details
Closed on
Jul 3, 2014
Sold by
County Of Cook
Bought by
Z Financial Illinois G Properties Llc
Current Estimated Value
Purchase Details
Closed on
Apr 6, 2006
Sold by
Thomas Candae R
Bought by
Grant Reginald C
Home Financials for this Owner
Home Financials are based on the most recent Mortgage that was taken out on this home.
Original Mortgage
$102,400
Interest Rate
8.47%
Mortgage Type
Unknown
Purchase Details
Closed on
Feb 17, 2006
Sold by
Clerk Regina
Bought by
Thomas Condae
Home Financials for this Owner
Home Financials are based on the most recent Mortgage that was taken out on this home.
Original Mortgage
$102,400
Interest Rate
8.47%
Mortgage Type
Unknown
Purchase Details
Closed on
Feb 2, 2006
Sold by
Deutsche Bank National Trust Co
Bought by
Clerk Regina
Purchase Details
Closed on
Jun 20, 1996
Sold by
Va
Bought by
Bankers Trust Company Of California Na and Vendee Mtg Trust 1996-2
Create a Home Valuation Report for This Property
The Home Valuation Report is an in-depth analysis detailing your home's value as well as a comparison with similar homes in the area
Home Values in the Area
Average Home Value in this Area
Purchase History
| Date | Buyer | Sale Price | Title Company |
|---|---|---|---|
| Z Financial Illinois G Properties Llc | -- | None Available | |
| Grant Reginald C | $128,000 | Pntn | |
| Thomas Condae | $62,000 | Lawyers | |
| Clerk Regina | -- | Lawyers | |
| Bankers Trust Company Of California Na | -- | Intercounty Title |
Source: Public Records
Mortgage History
| Date | Status | Borrower | Loan Amount |
|---|---|---|---|
| Previous Owner | Grant Reginald C | $102,400 |
Source: Public Records
Tax History Compared to Growth
Tax History
| Year | Tax Paid | Tax Assessment Tax Assessment Total Assessment is a certain percentage of the fair market value that is determined by local assessors to be the total taxable value of land and additions on the property. | Land | Improvement |
|---|---|---|---|---|
| 2024 | $4,052 | $6,200 | $1,289 | $4,911 |
| 2023 | $3,581 | $6,200 | $1,289 | $4,911 |
| 2022 | $3,581 | $4,404 | $1,289 | $3,115 |
| 2021 | $3,459 | $4,403 | $1,288 | $3,115 |
| 2020 | $3,554 | $4,403 | $1,288 | $3,115 |
| 2019 | $2,916 | $3,758 | $1,171 | $2,587 |
| 2018 | $2,846 | $3,758 | $1,171 | $2,587 |
| 2017 | $2,780 | $3,758 | $1,171 | $2,587 |
| 2016 | $3,408 | $5,265 | $1,054 | $4,211 |
| 2015 | $3,273 | $5,265 | $1,054 | $4,211 |
| 2014 | $3,265 | $5,265 | $1,054 | $4,211 |
| 2013 | $3,528 | $5,800 | $1,054 | $4,746 |
Source: Public Records
Map
Nearby Homes
- 14519 Harvey Ave
- 14502 Kentucky Ave
- 14523 Lexington Ave
- 111 E 144th Ct
- 14542 Sangamon St
- 14540 Loomis Ave
- 14600 Loomis Ave
- 14543 Myrtle Ave
- 14616 Loomis Ave
- 14622 Vincennes Rd
- 14637 Center Ave
- 14458 Peoria St
- 14631 Vincennes Rd
- 14637 Vincennes Rd
- 14725 Turlington Ave
- 14452 Green St
- 14735 Myrtle Ave
- 14817 Lexington Ave
- 14427 Halsted St
- 306 Calumet Blvd
- 14528 Kentucky Ave
- 14532 Kentucky Ave
- 14518 Kentucky Ave
- 14518 Kentucky Ave
- 14534 Kentucky Ave
- 14514 Kentucky Ave
- 14514 Kentucky Ave
- 14525 Harvey Ave
- 14525 Harvey Ave
- 14523 Harvey Ave
- 14529 Harvey Ave
- 14531 Harvey Ave
- 14536 Kentucky Ave
- 14510 Kentucky Ave
- 14515 Harvey Ave
- 14525 Kentucky Ave
- 14525 Kentucky Ave
- 14527 Kentucky Ave
- 14538 Kentucky Ave
- 14538 Kentucky Ave