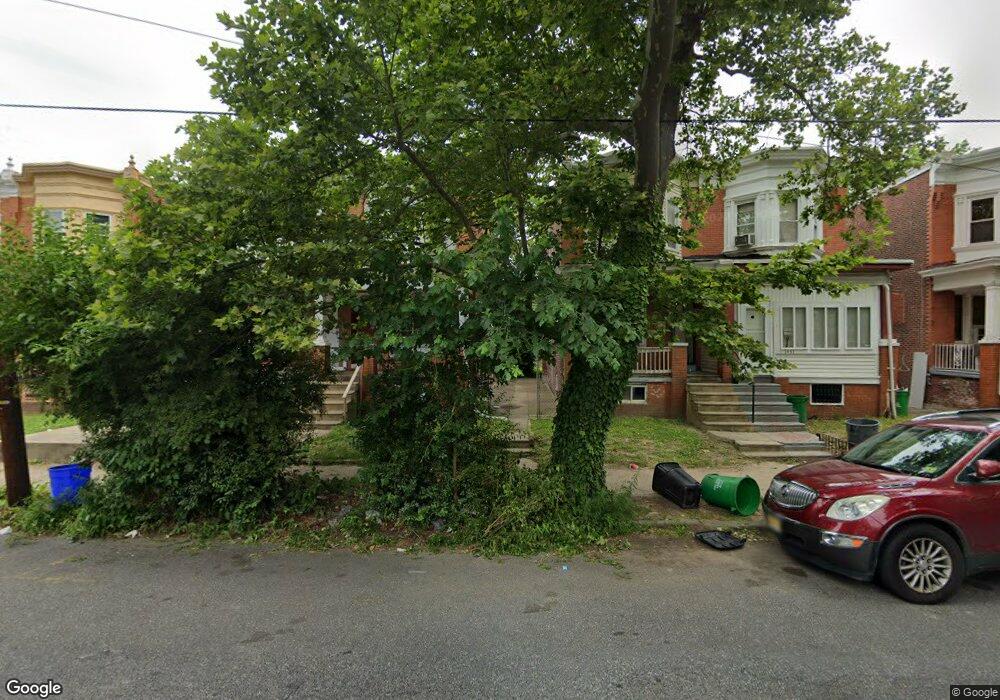
1453 Bradley Ave Camden, NJ 08103
Parkside NeighborhoodEstimated Value: $152,000 - $199,000
3
Beds
1
Bath
1,434
Sq Ft
$121/Sq Ft
Est. Value
About This Home
This home is located at 1453 Bradley Ave, Camden, NJ 08103 and is currently estimated at $173,623, approximately $121 per square foot. 1453 Bradley Ave is a home located in Camden County with nearby schools including Camden High School and Freedom Prep Charter School.
Ownership History
Date
Name
Owned For
Owner Type
Purchase Details
Closed on
Aug 4, 2022
Sold by
Federal Housing Commissioner
Bought by
Joseph Milara V
Current Estimated Value
Home Financials for this Owner
Home Financials are based on the most recent Mortgage that was taken out on this home.
Original Mortgage
$158,096
Interest Rate
5.13%
Mortgage Type
FHA
Purchase Details
Closed on
Aug 9, 2021
Sold by
Quicken Loans Llc
Bought by
Secretary Of Housing & Urban Development
Purchase Details
Closed on
Jul 15, 2020
Sold by
Secretary Of Housing And Urban Developme
Bought by
Quicken Loans Inc
Purchase Details
Closed on
Feb 7, 2018
Sold by
Quicken Loan Inc
Bought by
Secretary Of Housing & Urban Development
Purchase Details
Closed on
Nov 3, 2017
Sold by
Smith Valarie E
Bought by
Quicken Loans Inc
Purchase Details
Closed on
Nov 24, 1999
Sold by
Caban Jose
Bought by
Morales Minerva
Create a Home Valuation Report for This Property
The Home Valuation Report is an in-depth analysis detailing your home's value as well as a comparison with similar homes in the area
Home Values in the Area
Average Home Value in this Area
Purchase History
| Date | Buyer | Sale Price | Title Company |
|---|---|---|---|
| Joseph Milara V | $66,100 | -- | |
| Secretary Of Housing & Urban Development | -- | None Available | |
| Quicken Loans Inc | -- | None Listed On Document | |
| Secretary Of Housing & Urban Development | -- | None Available | |
| Quicken Loans Inc | -- | None Available | |
| Morales Minerva | $10,000 | -- |
Source: Public Records
Mortgage History
| Date | Status | Borrower | Loan Amount |
|---|---|---|---|
| Previous Owner | Joseph Milara V | $158,096 |
Source: Public Records
Tax History Compared to Growth
Tax History
| Year | Tax Paid | Tax Assessment Tax Assessment Total Assessment is a certain percentage of the fair market value that is determined by local assessors to be the total taxable value of land and additions on the property. | Land | Improvement |
|---|---|---|---|---|
| 2025 | $2,480 | $70,000 | $11,600 | $58,400 |
| 2024 | $2,398 | $70,000 | $11,600 | $58,400 |
| 2023 | $2,398 | $70,000 | $11,600 | $58,400 |
| 2022 | $2,344 | $70,000 | $11,600 | $58,400 |
| 2021 | $2,344 | $70,000 | $11,600 | $58,400 |
| 2020 | $2,226 | $70,000 | $11,600 | $58,400 |
| 2019 | $2,132 | $70,000 | $11,600 | $58,400 |
| 2018 | $2,120 | $70,000 | $11,600 | $58,400 |
| 2017 | $2,069 | $70,000 | $11,600 | $58,400 |
| 2016 | $2,003 | $70,000 | $11,600 | $58,400 |
| 2015 | $1,928 | $70,000 | $11,600 | $58,400 |
| 2014 | $1,882 | $70,000 | $11,600 | $58,400 |
Source: Public Records
Map
Nearby Homes
- 1411 Bradley Ave
- 1508 Bradley Ave
- 1407 Bradley Ave
- 1367 Kenwood Ave
- 1268 Kenwood Ave
- 1361 Kaighns Ave
- 1266 Magnolia Ave
- 1386 Haddon Ave
- 1433 Haddon Ave
- 1261 Kenwood Ave
- 1243 Magnolia Ave
- 1224 Empire Ave
- 1249 Kenwood Ave
- 1213 Empire Ave
- 1238 Haddon Ave
- 1510 Wildwood Ave
- 1327 Lansdowne Ave
- 1263 Lansdowne Ave
- 1113 Empire Ave
- 1257 Lansdowne Ave
- 1451 Bradley Ave
- 1455 Bradley Ave
- 1457 Bradley Ave
- 1449 Bradley Ave
- 1447 Bradley Ave
- 1459 Bradley Ave
- 1445 Bradley Ave
- 1461 Bradley Ave
- 1443 Bradley Ave
- 1463 Bradley Ave
- 1437 Bradley Ave
- 1465 Bradley Ave
- 1460 Kaighns Ave
- 1456 Kaighn Ave
- 1456 Kaighns Ave
- 1462 Kaighns Ave
- 1435 Bradley Ave
- 1454 Kaighns Ave
- 1464 Kaighns Ave