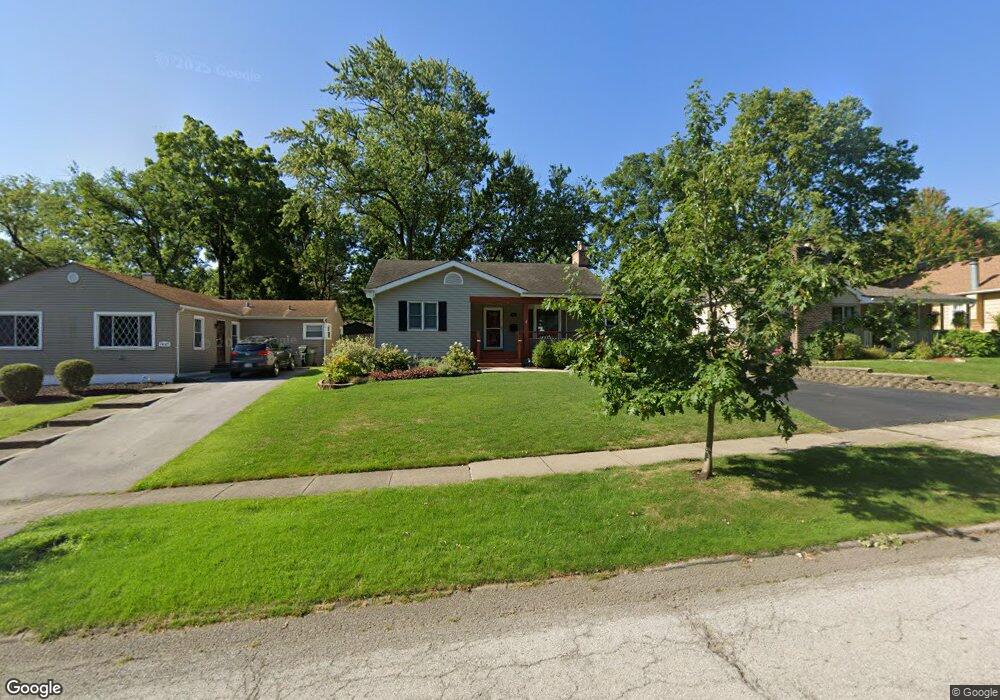
1453 Burr Oak Rd Homewood, IL 60430
Estimated Value: $278,000 - $306,000
2
Beds
2
Baths
1,673
Sq Ft
$174/Sq Ft
Est. Value
About This Home
This home is located at 1453 Burr Oak Rd, Homewood, IL 60430 and is currently estimated at $290,473, approximately $173 per square foot. 1453 Burr Oak Rd is a home located in Cook County with nearby schools including Willow Elementary School, Winston Churchill School, and James Hart School.
Ownership History
Date
Name
Owned For
Owner Type
Purchase Details
Closed on
Apr 12, 1999
Sold by
Watts Kenneth and Watts Delores Jo
Bought by
Guzinski Susan
Current Estimated Value
Home Financials for this Owner
Home Financials are based on the most recent Mortgage that was taken out on this home.
Original Mortgage
$80,238
Interest Rate
6.87%
Purchase Details
Closed on
Aug 1, 1997
Sold by
Chambers Michael D and Chambers Kelly A
Bought by
Watts Kenneth and Watts Delores Jo
Home Financials for this Owner
Home Financials are based on the most recent Mortgage that was taken out on this home.
Original Mortgage
$80,000
Interest Rate
8.25%
Purchase Details
Closed on
Apr 5, 1994
Sold by
Hevel James Brian and Hevel Amy Louise
Bought by
Chambers Michael D and Chambers Kelly A
Home Financials for this Owner
Home Financials are based on the most recent Mortgage that was taken out on this home.
Original Mortgage
$74,400
Interest Rate
7%
Create a Home Valuation Report for This Property
The Home Valuation Report is an in-depth analysis detailing your home's value as well as a comparison with similar homes in the area
Home Values in the Area
Average Home Value in this Area
Purchase History
| Date | Buyer | Sale Price | Title Company |
|---|---|---|---|
| Guzinski Susan | -- | -- | |
| Watts Kenneth | $101,000 | -- | |
| Chambers Michael D | $62,000 | -- |
Source: Public Records
Mortgage History
| Date | Status | Borrower | Loan Amount |
|---|---|---|---|
| Closed | Guzinski Susan | $80,238 | |
| Previous Owner | Watts Kenneth | $80,000 | |
| Previous Owner | Chambers Michael D | $74,400 |
Source: Public Records
Tax History Compared to Growth
Tax History
| Year | Tax Paid | Tax Assessment Tax Assessment Total Assessment is a certain percentage of the fair market value that is determined by local assessors to be the total taxable value of land and additions on the property. | Land | Improvement |
|---|---|---|---|---|
| 2024 | $9,721 | $26,000 | $3,360 | $22,640 |
| 2023 | $6,017 | $26,000 | $3,360 | $22,640 |
| 2022 | $6,017 | $14,637 | $2,940 | $11,697 |
| 2021 | $5,656 | $14,637 | $2,940 | $11,697 |
| 2020 | $5,586 | $14,637 | $2,940 | $11,697 |
| 2019 | $5,638 | $14,659 | $2,730 | $11,929 |
| 2018 | $5,454 | $14,659 | $2,730 | $11,929 |
| 2017 | $5,490 | $14,659 | $2,730 | $11,929 |
| 2016 | $5,455 | $13,484 | $2,520 | $10,964 |
| 2015 | $5,342 | $13,484 | $2,520 | $10,964 |
| 2014 | $5,267 | $13,484 | $2,520 | $10,964 |
| 2013 | $5,579 | $15,220 | $2,520 | $12,700 |
Source: Public Records
Map
Nearby Homes
- 1525 Burr Oak Rd
- 1624 Burr Oak Rd
- 1554 Olive Rd
- 1214 Ridge Rd
- 18110 Center Ave
- 1728 Olive Rd
- 1758 Pine Rd
- 17919 Homewood Ave
- 1607 183rd St
- 1617 183rd St
- 1655 183rd St
- 1121 Olive Rd
- 1406 Birch Rd
- 1850 Pine Rd
- 1750 183rd St
- 1852 Sycamore Rd
- 1208 Evergreen Rd
- 1120 183rd St
- 17739 Harwood Ave
- 1129 183rd St
- 1457 Burr Oak Rd
- 1447 Burr Oak Rd
- 1461 Burr Oak Rd
- 1441 Burr Oak Rd
- 1467 Burr Oak Rd
- 1437 Burr Oak Rd
- 1446 Linden Rd
- 1440 Linden Rd
- 1454 Burr Oak Rd
- 1460 Linden Rd
- 1436 Linden Rd
- 1450 Burr Oak Rd
- 1446 Burr Oak Rd
- 1435 Burr Oak Rd
- 1469 Burr Oak Rd
- 1440 Burr Oak Rd
- 1460 Burr Oak Rd
- 1464 Linden Rd
- 1432 Linden Rd
- 1423 Burr Oak Rd