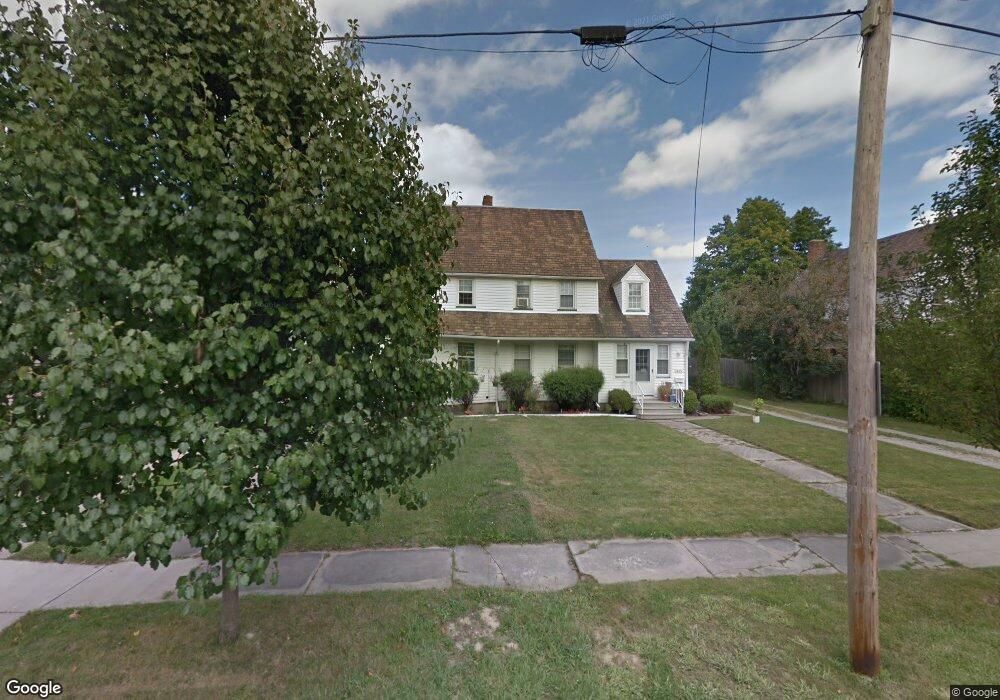
1453 D St Lorain, OH 44052
Estimated Value: $108,237 - $159,000
2
Beds
1
Bath
1,092
Sq Ft
$120/Sq Ft
Est. Value
About This Home
This home is located at 1453 D St, Lorain, OH 44052 and is currently estimated at $130,809, approximately $119 per square foot. 1453 D St is a home located in Lorain County with nearby schools including Larkmoor Elementary School, Longfellow Middle School, and Lorain High School.
Ownership History
Date
Name
Owned For
Owner Type
Purchase Details
Closed on
Apr 5, 2018
Sold by
David & Prancine Properties Llc
Bought by
Nicoletti Toni Anne
Current Estimated Value
Purchase Details
Closed on
May 25, 2010
Sold by
Petroskey David N and Petroskey Francine
Bought by
David & Francine Properties Llc
Purchase Details
Closed on
Oct 12, 1994
Sold by
Pappas Helen
Bought by
Petroskey David N and Petroskey Francine D
Home Financials for this Owner
Home Financials are based on the most recent Mortgage that was taken out on this home.
Original Mortgage
$18,800
Interest Rate
8.55%
Mortgage Type
New Conventional
Create a Home Valuation Report for This Property
The Home Valuation Report is an in-depth analysis detailing your home's value as well as a comparison with similar homes in the area
Home Values in the Area
Average Home Value in this Area
Purchase History
| Date | Buyer | Sale Price | Title Company |
|---|---|---|---|
| Nicoletti Toni Anne | -- | None Available | |
| David & Francine Properties Llc | -- | Attorney | |
| Petroskey David N | $23,600 | -- |
Source: Public Records
Mortgage History
| Date | Status | Borrower | Loan Amount |
|---|---|---|---|
| Previous Owner | Petroskey David N | $18,800 |
Source: Public Records
Tax History
| Year | Tax Paid | Tax Assessment Tax Assessment Total Assessment is a certain percentage of the fair market value that is determined by local assessors to be the total taxable value of land and additions on the property. | Land | Improvement |
|---|---|---|---|---|
| 2024 | $1,349 | $31,924 | $4,561 | $27,363 |
| 2023 | $1,057 | $20,003 | $5,961 | $14,042 |
| 2022 | $1,048 | $20,003 | $5,961 | $14,042 |
| 2021 | $1,048 | $20,003 | $5,961 | $14,042 |
| 2020 | $974 | $16,160 | $4,820 | $11,340 |
| 2019 | $969 | $16,160 | $4,820 | $11,340 |
| 2018 | $1,000 | $16,160 | $4,820 | $11,340 |
| 2017 | $1,030 | $16,190 | $4,220 | $11,970 |
| 2016 | $1,022 | $16,190 | $4,220 | $11,970 |
| 2015 | $966 | $16,190 | $4,220 | $11,970 |
| 2014 | $964 | $16,190 | $4,220 | $11,970 |
| 2013 | $956 | $16,190 | $4,220 | $11,970 |
Source: Public Records
Map
Nearby Homes
- 326 Indiana Ave
- 317 Illinois Ave
- 1122 F St
- 117 Idaho Ave
- 906 E Erie Ave
- V/L Maryland Ave
- 2235 E Erie Ave
- 811 F St
- 1545 Fillmore Ave
- 426 Delaware Ave
- 1397 Colorado Ave
- 2235 Crehore St
- 2149 Hancock St
- 465 California Ave
- 461 Harbor Ln
- 457 Harbor Ln
- 453 Harbor Ln
- 445 Harbor Ln
- 449 Harbor Ln
- 323 California Ave
Your Personal Tour Guide
Ask me questions while you tour the home.