Estimated Value: $695,000 - $867,305
3
Beds
4
Baths
1,821
Sq Ft
$433/Sq Ft
Est. Value
About This Home
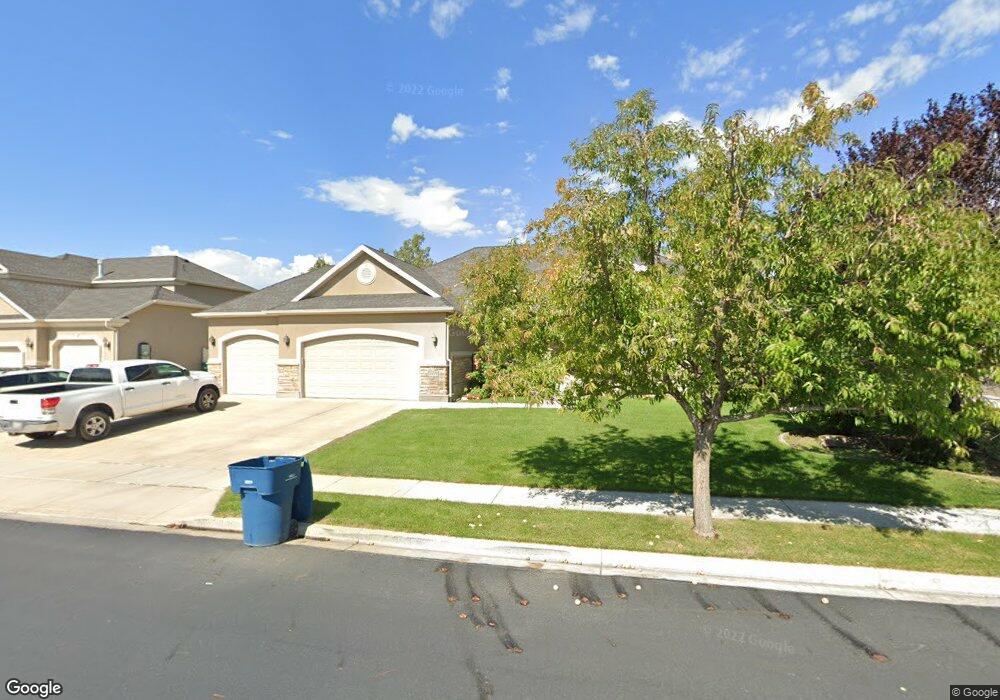
This home is located at 1453 E 450 N, Lehi, UT 84043 and is currently estimated at $787,768, approximately $432 per square foot. 1453 E 450 N is a home located in Utah County with nearby schools including Sego Lily Elementary School, Lehi Junior High School, and Skyridge High School.
Ownership History
Date
Name
Owned For
Owner Type
Purchase Details
Closed on
Sep 25, 2018
Sold by
Burnham Kemp
Bought by
Burnham Kemp and Burnham Amy
Current Estimated Value
Home Financials for this Owner
Home Financials are based on the most recent Mortgage that was taken out on this home.
Original Mortgage
$270,000
Outstanding Balance
$235,456
Interest Rate
4.5%
Mortgage Type
New Conventional
Estimated Equity
$552,312
Purchase Details
Closed on
Dec 14, 2005
Sold by
Ivory Homes Ltd
Bought by
Burnham Kemp and Burnham Amy
Home Financials for this Owner
Home Financials are based on the most recent Mortgage that was taken out on this home.
Original Mortgage
$37,600
Interest Rate
6.35%
Mortgage Type
Stand Alone Second
Create a Home Valuation Report for This Property
The Home Valuation Report is an in-depth analysis detailing your home's value as well as a comparison with similar homes in the area
Home Values in the Area
Average Home Value in this Area
Purchase History
| Date | Buyer | Sale Price | Title Company |
|---|---|---|---|
| Burnham Kemp | -- | Vanguard Title Ins Agency | |
| Burnham Kemp | -- | Vanguard Title Ins Agency | |
| Burnham Kemp | -- | Cottonwood Title Insurance | |
| Ivory Homes Ltd | -- | Cottonwood Title Insurance |
Source: Public Records
Mortgage History
| Date | Status | Borrower | Loan Amount |
|---|---|---|---|
| Open | Burnham Kemp | $270,000 | |
| Closed | Ivory Homes Ltd | $37,600 | |
| Closed | Burnham Kemp | $241,000 |
Source: Public Records
Tax History
| Year | Tax Paid | Tax Assessment Tax Assessment Total Assessment is a certain percentage of the fair market value that is determined by local assessors to be the total taxable value of land and additions on the property. | Land | Improvement |
|---|---|---|---|---|
| 2025 | $3,383 | $454,410 | -- | -- |
| 2024 | $3,383 | $395,890 | $0 | $0 |
| 2023 | $3,073 | $390,500 | $0 | $0 |
| 2022 | $3,129 | $385,440 | $0 | $0 |
| 2021 | $2,793 | $520,200 | $167,600 | $352,600 |
| 2020 | $2,633 | $484,700 | $155,200 | $329,500 |
| 2019 | $2,308 | $441,700 | $155,200 | $286,500 |
| 2018 | $2,135 | $386,200 | $137,100 | $249,100 |
| 2017 | $2,208 | $212,410 | $0 | $0 |
| 2016 | $2,269 | $202,510 | $0 | $0 |
| 2015 | $2,355 | $199,485 | $0 | $0 |
| 2014 | $2,005 | $168,850 | $0 | $0 |
Source: Public Records
Map
Nearby Homes
- 499 N 1520 E
- 556 N 1440 E
- 414 N 1322 E
- 822 N 860 W Unit 317
- 893 N 1580 E
- 822 W 800 St N Unit LOT319
- 4007 W 1000 N
- 3947 W 1000 N Unit 439
- 3971 W 1000 N Unit 441
- 3959 W 1000 N
- 3995 W 1000 N
- 764 W 880 North St Unit 308
- 1175 E 900 N
- 484 N 950 W Unit 7
- 672 W 900 N
- 831 N 600 W
- 890 N Whipple Dr
- 832 N Somerset Aly
- 807 N Somerset Aly
- 777 W State Rd
Your Personal Tour Guide
Ask me questions while you tour the home.