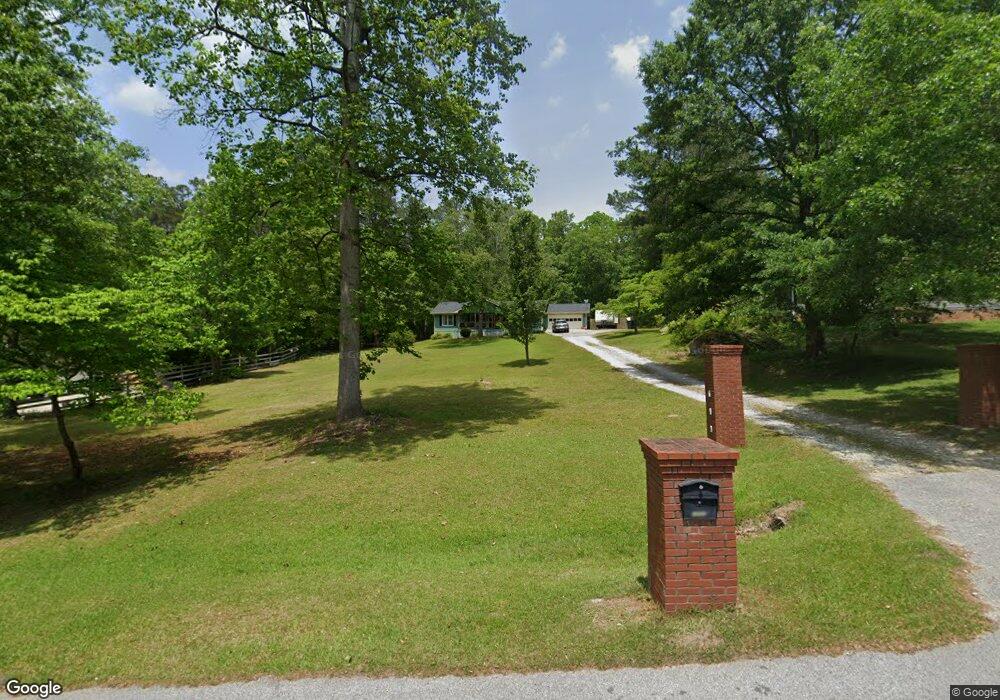
1453 Enchanted Lake Dr NW Conyers, GA 30012
Estimated Value: $223,000 - $253,000
2
Beds
2
Baths
1,856
Sq Ft
$127/Sq Ft
Est. Value
About This Home
This home is located at 1453 Enchanted Lake Dr NW, Conyers, GA 30012 and is currently estimated at $236,626, approximately $127 per square foot. 1453 Enchanted Lake Dr NW is a home located in Rockdale County with nearby schools including House Elementary School, Conyers Middle School, and Rockdale County High School.
Ownership History
Date
Name
Owned For
Owner Type
Purchase Details
Closed on
May 7, 2009
Sold by
Cwabs Inc Series 2006-7
Bought by
Skinner Linda A
Current Estimated Value
Home Financials for this Owner
Home Financials are based on the most recent Mortgage that was taken out on this home.
Original Mortgage
$48,996
Outstanding Balance
$30,857
Interest Rate
4.79%
Mortgage Type
FHA
Estimated Equity
$205,769
Purchase Details
Closed on
Sep 2, 2008
Sold by
Coleman Doyle W
Bought by
Cwabs Inc Series 2006-7
Purchase Details
Closed on
Jun 9, 2006
Sold by
Mcclure Martin L
Bought by
Coleman Doyle W
Home Financials for this Owner
Home Financials are based on the most recent Mortgage that was taken out on this home.
Original Mortgage
$22,660
Interest Rate
6.49%
Mortgage Type
Stand Alone Refi Refinance Of Original Loan
Purchase Details
Closed on
Mar 24, 2006
Sold by
Polk Robert L
Bought by
Mcclure Martin L
Create a Home Valuation Report for This Property
The Home Valuation Report is an in-depth analysis detailing your home's value as well as a comparison with similar homes in the area
Home Values in the Area
Average Home Value in this Area
Purchase History
| Date | Buyer | Sale Price | Title Company |
|---|---|---|---|
| Skinner Linda A | $49,900 | -- | |
| Cwabs Inc Series 2006-7 | $68,000 | -- | |
| Coleman Doyle W | $113,300 | -- | |
| Mcclure Martin L | $75,000 | -- |
Source: Public Records
Mortgage History
| Date | Status | Borrower | Loan Amount |
|---|---|---|---|
| Open | Skinner Linda A | $48,996 | |
| Previous Owner | Coleman Doyle W | $22,660 |
Source: Public Records
Tax History Compared to Growth
Tax History
| Year | Tax Paid | Tax Assessment Tax Assessment Total Assessment is a certain percentage of the fair market value that is determined by local assessors to be the total taxable value of land and additions on the property. | Land | Improvement |
|---|---|---|---|---|
| 2024 | $1,922 | $83,040 | $21,200 | $61,840 |
| 2023 | $1,254 | $59,400 | $13,320 | $46,080 |
| 2022 | $1,144 | $55,120 | $13,320 | $41,800 |
| 2021 | $1,124 | $51,880 | $12,800 | $39,080 |
| 2020 | $682 | $37,720 | $6,400 | $31,320 |
| 2019 | $699 | $37,720 | $6,400 | $31,320 |
| 2018 | $547 | $32,680 | $4,960 | $27,720 |
| 2017 | $441 | $29,040 | $4,960 | $24,080 |
| 2016 | $407 | $29,040 | $4,960 | $24,080 |
| 2015 | $370 | $27,720 | $5,000 | $22,720 |
| 2014 | $369 | $29,080 | $5,000 | $24,080 |
| 2013 | -- | $30,000 | $7,200 | $22,800 |
Source: Public Records
Map
Nearby Homes
- 1490 Enchanted Lake Dr NW
- 1283 Corley Rd NW
- Hayden Plan at Champion's Run
- Penwell Plan at Champion's Run
- Macon Plan at Champion's Run
- Cali Plan at Champion's Run
- Galen Plan at Champion's Run
- Kerry Plan at Champion's Run
- 8564 Secretariat Dr
- 8601 Secretariat Dr
- 8599 Secretariat Dr
- 8591 Secretariat Dr
- 8592 Secretariat Dr
- 8929 Pleasant Hill Rd
- 8581 Secretariat Dr
- 1629 Palladian Way
- 8584 Seabiscuit Rd
- 1627 Palladian Way
- 1625 Palladian Way
- 8568 Secretariat Dr
- 1437 Enchanted Lake Dr NW
- 0 Enchanted Lake Dr NW Unit 3219209
- 1467 Enchanted Lake Dr NW
- 1423 Enchanted Lake Dr NW
- 1456 Enchanted Lake Dr NW
- 1430 Enchanted Lake Dr NW
- 1409 Enchanted Lake Dr NW
- 1515 Enchanted Lake Dr NW
- 1505 Humphries Rd NW
- 1400 Enchanted Lake Dr NW
- 1431 Humphries Rd NW
- 3552 Enchanted Lake Ct NW
- 3564 Enchanted Lake Ct NW
- 3582 Enchanted Lake Ct NW
- 1389 Enchanted Lake Dr NW
- 1386 Enchanted Lake Dr NW
- 1531 Twin Valley Trail
- 1486 Enchanted Lake Dr NW
- 3606 Enchanted Lake Ct NW
- 0 Enchanted Lake Ct NW