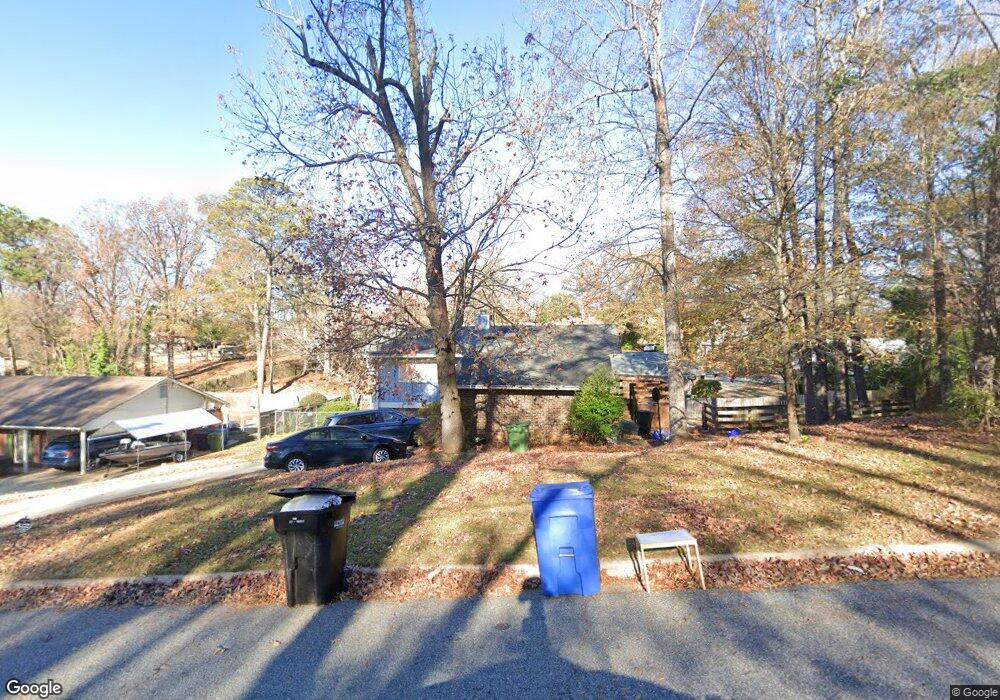
1453 Fox Croft Loop Columbus, GA 31904
North Columbus NeighborhoodEstimated Value: $235,000 - $272,000
3
Beds
3
Baths
949
Sq Ft
$271/Sq Ft
Est. Value
About This Home
This home is located at 1453 Fox Croft Loop, Columbus, GA 31904 and is currently estimated at $257,257, approximately $271 per square foot. 1453 Fox Croft Loop is a home located in Muscogee County with nearby schools including River Road Elementary School, Double Churches Middle School, and Northside High School.
Ownership History
Date
Name
Owned For
Owner Type
Purchase Details
Closed on
Feb 15, 2021
Sold by
Edenfield Jane I
Bought by
Sonnenschein Jeremy and Brown Skyla
Current Estimated Value
Purchase Details
Closed on
Jan 25, 2012
Sold by
Jones Sharon
Bought by
Jones Edenfield I and Jones Sharon
Home Financials for this Owner
Home Financials are based on the most recent Mortgage that was taken out on this home.
Original Mortgage
$146,803
Interest Rate
4.4%
Mortgage Type
FHA
Purchase Details
Closed on
Feb 29, 2008
Sold by
Wilson Robert E
Bought by
Jones Sharon and Brown Darleen
Home Financials for this Owner
Home Financials are based on the most recent Mortgage that was taken out on this home.
Original Mortgage
$151,741
Interest Rate
5.46%
Mortgage Type
FHA
Create a Home Valuation Report for This Property
The Home Valuation Report is an in-depth analysis detailing your home's value as well as a comparison with similar homes in the area
Home Values in the Area
Average Home Value in this Area
Purchase History
| Date | Buyer | Sale Price | Title Company |
|---|---|---|---|
| Sonnenschein Jeremy | $172,000 | -- | |
| Jones Edenfield I | -- | -- | |
| Jones Sharon | -- | -- | |
| Jones Sharon | $154,200 | None Available |
Source: Public Records
Mortgage History
| Date | Status | Borrower | Loan Amount |
|---|---|---|---|
| Previous Owner | Jones Sharon | $146,803 | |
| Previous Owner | Jones Sharon | $151,741 |
Source: Public Records
Tax History
| Year | Tax Paid | Tax Assessment Tax Assessment Total Assessment is a certain percentage of the fair market value that is determined by local assessors to be the total taxable value of land and additions on the property. | Land | Improvement |
|---|---|---|---|---|
| 2025 | $3,226 | $82,424 | $22,532 | $59,892 |
| 2024 | $3,226 | $82,424 | $22,532 | $59,892 |
| 2023 | $3,247 | $82,424 | $22,532 | $59,892 |
| 2022 | $2,667 | $65,328 | $16,896 | $48,432 |
| 2021 | $1,006 | $59,916 | $16,896 | $43,020 |
| 2020 | $2,502 | $59,916 | $16,896 | $43,020 |
| 2019 | $2,512 | $59,916 | $16,896 | $43,020 |
| 2018 | $2,512 | $59,916 | $16,896 | $43,020 |
| 2017 | $2,522 | $59,916 | $16,896 | $43,020 |
| 2016 | $2,532 | $74,661 | $5,036 | $69,625 |
| 2015 | $2,536 | $74,661 | $5,036 | $69,625 |
| 2014 | $2,540 | $74,661 | $5,036 | $69,625 |
| 2013 | -- | $74,661 | $5,036 | $69,625 |
Source: Public Records
Map
Nearby Homes
- 1440 Blanchfield Dr
- 6802 Ellis Dr
- 6817 Whitesville Rd
- 6818 Fawndale Dr
- 6836 Sharmel Ln
- 1512 Tom Buk Tu Ln
- 7047 Mellwood Rd
- 1430 Cloverdale Rd
- 1355 Cloverdale Rd
- 6982 Buckhorn Dr
- 1195 Cloverdale Rd
- 16 Kylemore Ct
- 8008 Lagoon Ct
- 1254 Cottage Pointe Ct
- 1235 Cottage Pointe Ct
- 911 Oakwood Dr
- 7301 Paprika Ln
- 1608 Double Churches Rd
- 6333 Cape Cod Dr
- 7407 Peppercorn Dr
- 1453 Foxcroft Loop
- 1450 Autumnridge Dr
- 1447 Fox Croft Loop
- 1442 Autumnridge Dr
- 1501 Fox Croft Loop
- 1501 Foxcroft Loop
- 1452 Fox Croft Loop
- 1458 Fox Croft Loop
- 1441 Fox Croft Loop
- 1446 Fox Croft Loop
- 1502 Fox Croft Loop
- 1435 Foxcroft Loop
- 1502 Foxcroft Loop
- 1426 Autumnridge Dr
- 1435 Fox Croft Loop
- 1442 Fox Croft Loop
- 1457 Autumnridge Dr
- 1449 Autumnridge Dr
- 1508 Fox Croft Loop
- 1501 Autumnridge Dr