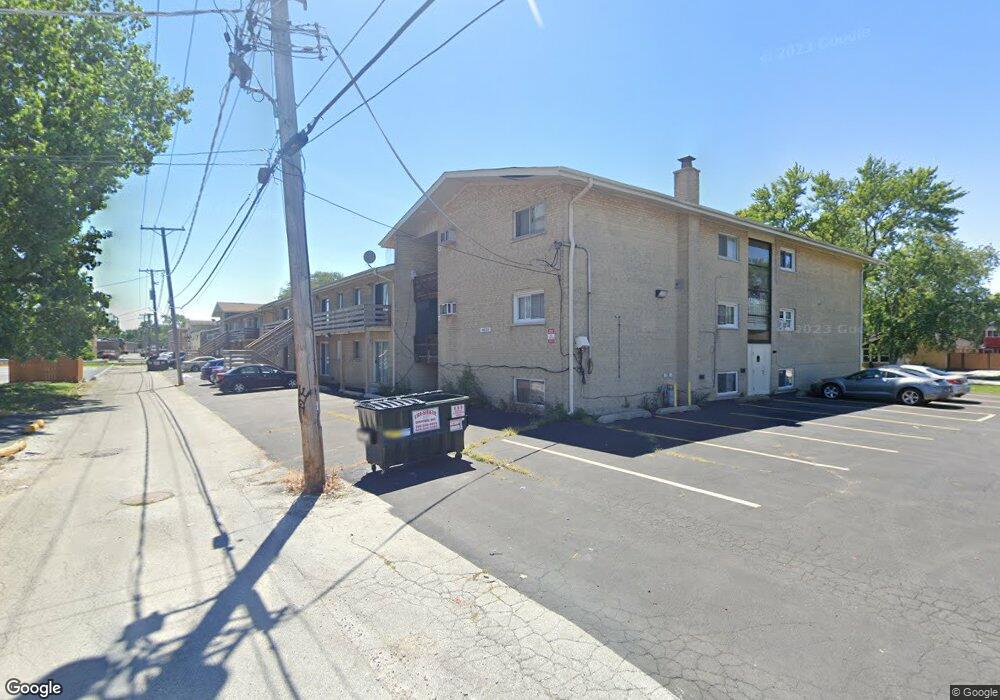
14533 Keystone Ave Unit 14533 Midlothian, IL 60445
Estimated Value: $76,000 - $103,000
1
Bed
1
Bath
850
Sq Ft
$104/Sq Ft
Est. Value
About This Home
This home is located at 14533 Keystone Ave Unit 14533, Midlothian, IL 60445 and is currently estimated at $88,023, approximately $103 per square foot. 14533 Keystone Ave Unit 14533 is a home located in Cook County with nearby schools including Springfield Elementary School, Bremen High School, and St. Christopher School.
Ownership History
Date
Name
Owned For
Owner Type
Purchase Details
Closed on
Jul 31, 2018
Sold by
Bienkowski Gitana
Bought by
Hroma George
Current Estimated Value
Purchase Details
Closed on
Nov 12, 2014
Sold by
Mescall John
Bought by
Beinkowski Gitana
Purchase Details
Closed on
May 31, 2007
Sold by
Demilio Gregory J
Bought by
Mescall John
Home Financials for this Owner
Home Financials are based on the most recent Mortgage that was taken out on this home.
Original Mortgage
$58,000
Interest Rate
6.26%
Mortgage Type
Unknown
Purchase Details
Closed on
Jan 5, 2007
Sold by
Standard Bank & Trust Co
Bought by
Demilio Gregory J
Home Financials for this Owner
Home Financials are based on the most recent Mortgage that was taken out on this home.
Original Mortgage
$50,350
Interest Rate
6.22%
Mortgage Type
Purchase Money Mortgage
Create a Home Valuation Report for This Property
The Home Valuation Report is an in-depth analysis detailing your home's value as well as a comparison with similar homes in the area
Home Values in the Area
Average Home Value in this Area
Purchase History
| Date | Buyer | Sale Price | Title Company |
|---|---|---|---|
| Hroma George | $33,000 | Fidelity National Title | |
| Beinkowski Gitana | $18,500 | None Available | |
| Mescall John | $73,000 | Multiple | |
| Demilio Gregory J | $53,000 | First American Title |
Source: Public Records
Mortgage History
| Date | Status | Borrower | Loan Amount |
|---|---|---|---|
| Previous Owner | Mescall John | $58,000 | |
| Previous Owner | Demilio Gregory J | $50,350 |
Source: Public Records
Tax History Compared to Growth
Tax History
| Year | Tax Paid | Tax Assessment Tax Assessment Total Assessment is a certain percentage of the fair market value that is determined by local assessors to be the total taxable value of land and additions on the property. | Land | Improvement |
|---|---|---|---|---|
| 2024 | $2,466 | $6,515 | $606 | $5,909 |
| 2023 | $1,431 | $6,515 | $606 | $5,909 |
| 2022 | $1,431 | $3,046 | $530 | $2,516 |
| 2021 | $1,375 | $3,045 | $530 | $2,515 |
| 2020 | $1,310 | $3,045 | $530 | $2,515 |
| 2019 | $1,076 | $2,477 | $492 | $1,985 |
| 2018 | $1,059 | $2,477 | $492 | $1,985 |
| 2017 | $1,021 | $2,477 | $492 | $1,985 |
| 2016 | $1,307 | $5,544 | $416 | $5,128 |
| 2015 | $2,326 | $5,544 | $416 | $5,128 |
| 2014 | $1,211 | $5,544 | $416 | $5,128 |
| 2013 | $1,388 | $6,423 | $416 | $6,007 |
Source: Public Records
Map
Nearby Homes
- 14539 Crawford Ave
- 14613 Keystone Ave
- 14501 Keystone Ave Unit 8
- 14618 Keystone Ave
- 4031 147th St
- 14501 Tripp Ave
- 14431 Tripp Ave
- 14301 Hamlin Ave
- 3902 Claire Blvd
- 14837 Karlov Ave
- 14540 Kolin Ave
- 14903 Terrace Ln
- 14401 Kolin Ave
- 14545 Kostner Ave
- 3846 149th St
- 14503 Waverly Ave
- 14328 Lawndale Ave
- 14632 Kostner Ave
- 14914 Avers Ave
- 3631 147th St
- 14533 Keystone Ave Unit 2
- 14533 Keystone Ave Unit 6
- 14533 Keystone Ave Unit 9
- 14533 Keystone Ave Unit 14533
- 14533 Keystone Ave Unit 14533
- 14533 Keystone Ave Unit 14533
- 14533 Keystone Ave Unit 14533
- 14533 Keystone Ave Unit 14533
- 14533 Keystone Ave Unit 14533
- 14533 Keystone Ave Unit 14533
- 14533 Keystone Ave Unit 14533
- 14533 Keystone Ave Unit 14533
- 14533 Keystone Ave Unit 14533
- 14533 Keystone Ave Unit 14533
- 14533 Keystone Ave Unit 5
- 14533 Keystone Ave Unit 4
- 14533 Keystone Ave Unit 10
- 14547 Keystone Ave Unit 2
- 14547 Keystone Ave Unit 7
- 14547 Keystone Ave Unit 14547