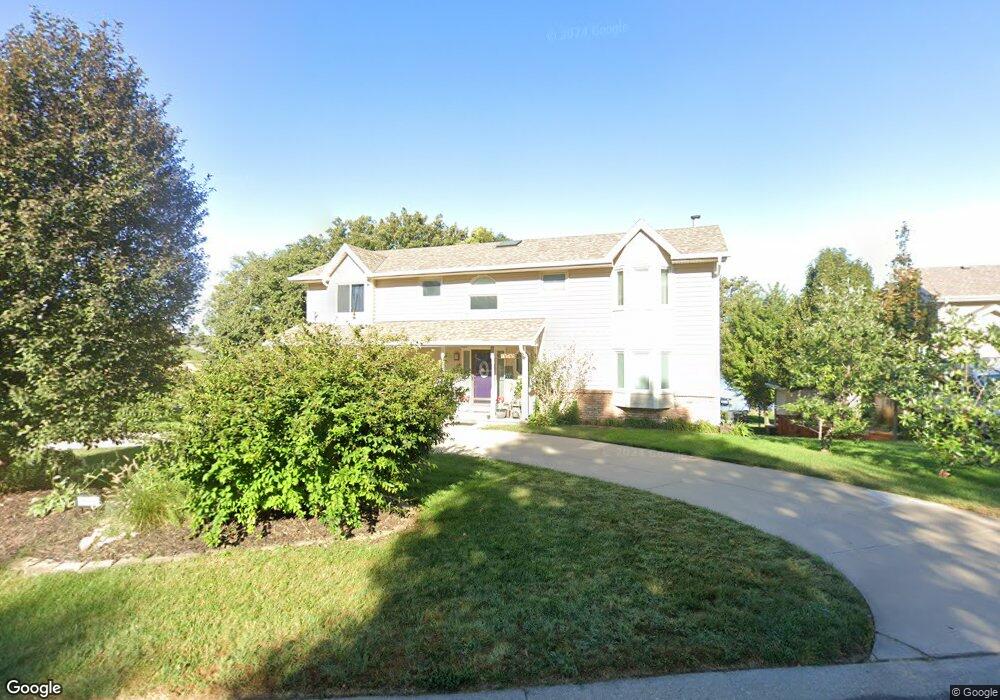
14543 Fir Cir Plattsmouth, NE 68048
Estimated Value: $582,285 - $707,000
4
Beds
4
Baths
3,988
Sq Ft
$158/Sq Ft
Est. Value
About This Home
This home is located at 14543 Fir Cir, Plattsmouth, NE 68048 and is currently estimated at $629,321, approximately $157 per square foot. 14543 Fir Cir is a home located in Cass County with nearby schools including Plattsmouth Elementary School, Plattsmouth Middle School, and Plattsmouth High School.
Ownership History
Date
Name
Owned For
Owner Type
Purchase Details
Closed on
Apr 26, 2024
Sold by
Overland Lance M and Overland Karen M
Bought by
Perry Family Trust and Overland
Current Estimated Value
Purchase Details
Closed on
Jun 23, 2009
Sold by
Sullivan Mike
Bought by
Sullivan Mike
Home Financials for this Owner
Home Financials are based on the most recent Mortgage that was taken out on this home.
Original Mortgage
$168,000
Interest Rate
4.84%
Mortgage Type
Purchase Money Mortgage
Purchase Details
Closed on
Jun 3, 2009
Sold by
Sullivan Mike
Bought by
Overland Lance M and Pelzer Overland Karen
Home Financials for this Owner
Home Financials are based on the most recent Mortgage that was taken out on this home.
Original Mortgage
$168,000
Interest Rate
4.84%
Mortgage Type
Purchase Money Mortgage
Create a Home Valuation Report for This Property
The Home Valuation Report is an in-depth analysis detailing your home's value as well as a comparison with similar homes in the area
Home Values in the Area
Average Home Value in this Area
Purchase History
| Date | Buyer | Sale Price | Title Company |
|---|---|---|---|
| Perry Family Trust | -- | None Listed On Document | |
| Sullivan Mike | -- | -- | |
| Overland Lance M | $210,000 | -- |
Source: Public Records
Mortgage History
| Date | Status | Borrower | Loan Amount |
|---|---|---|---|
| Previous Owner | Sullivan Mike | $168,000 |
Source: Public Records
Tax History Compared to Growth
Tax History
| Year | Tax Paid | Tax Assessment Tax Assessment Total Assessment is a certain percentage of the fair market value that is determined by local assessors to be the total taxable value of land and additions on the property. | Land | Improvement |
|---|---|---|---|---|
| 2024 | $5,229 | $418,830 | $80,325 | $338,505 |
| 2023 | $6,517 | $394,030 | $56,150 | $337,880 |
| 2022 | $6,382 | $394,853 | $59,063 | $335,790 |
| 2021 | $5,876 | $360,060 | $56,250 | $303,810 |
| 2020 | $5,526 | $324,852 | $60,750 | $264,102 |
| 2019 | $5,055 | $300,789 | $56,250 | $244,539 |
| 2018 | $5,248 | $300,789 | $56,250 | $244,539 |
| 2017 | $5,281 | $300,711 | $45,001 | $255,710 |
| 2016 | $5,179 | $300,711 | $45,001 | $255,710 |
| 2015 | $5,098 | $300,711 | $45,001 | $255,710 |
| 2014 | $5,297 | $300,711 | $45,001 | $255,710 |
Source: Public Records
Map
Nearby Homes
- 14514 Elder Cir
- LOT 23 LV III - Phase 2 St
- LOT 15 LV III - Phase 2 St
- LOT 5 LV III - Phase 2 St
- LOT 18 LV III - Phase 2 St
- LOT 8 LV III - Phase 2 St
- LOT 11 LV III - Phase 2 St
- LOT 16 LV III - Phase 2 St
- LOT 20 LV III - Phase 2 St
- LOT 17 LV III - Phase 2 St
- LOT 19 LV III - Phase 2 St
- LOT 7 LV III - Phase 2 St
- 4219 Windward Dr
- 19325 Spyglass Ct
- 3819 Buccaneer Blvd
- 19617 Ridgeway Rd
- Parcel 130015458 St
- 19719 Sterling Ct
- 2493 Buccaneer Blvd
- 2903 Lakeside Dr