Estimated Value: $152,000 - $251,956
3
Beds
1
Bath
2,070
Sq Ft
$93/Sq Ft
Est. Value
About This Home
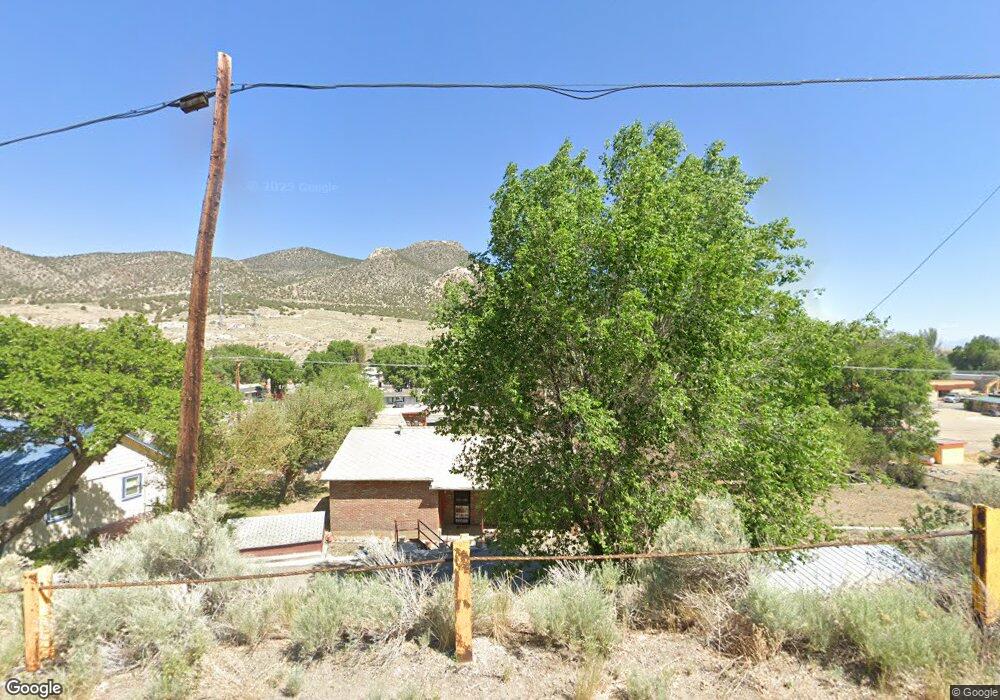
This home is located at 1455 Campton St, Ely, NV 89301 and is currently estimated at $191,739, approximately $92 per square foot. 1455 Campton St is a home located in White Pine County with nearby schools including David E. Norman Elementary School, White Pine Middle School, and White Pine High School.
Ownership History
Date
Name
Owned For
Owner Type
Purchase Details
Closed on
Sep 6, 2025
Sold by
Knight Kay and Knight Aaron
Bought by
Rose-Boker Aleice and Boker Marcus
Current Estimated Value
Home Financials for this Owner
Home Financials are based on the most recent Mortgage that was taken out on this home.
Original Mortgage
$156,565
Outstanding Balance
$156,293
Interest Rate
6.72%
Mortgage Type
New Conventional
Estimated Equity
$35,446
Purchase Details
Closed on
Mar 6, 2014
Sold by
Lewis E Lewis E and Sandberg Lewis Edward
Bought by
Knight Kay E and Knight Aaron S
Create a Home Valuation Report for This Property
The Home Valuation Report is an in-depth analysis detailing your home's value as well as a comparison with similar homes in the area
Home Values in the Area
Average Home Value in this Area
Purchase History
| Date | Buyer | Sale Price | Title Company |
|---|---|---|---|
| Rose-Boker Aleice | $155,000 | Monument Title Insurance Inc | |
| Knight Kay E | -- | -- |
Source: Public Records
Mortgage History
| Date | Status | Borrower | Loan Amount |
|---|---|---|---|
| Open | Rose-Boker Aleice | $156,565 |
Source: Public Records
Tax History
| Year | Tax Paid | Tax Assessment Tax Assessment Total Assessment is a certain percentage of the fair market value that is determined by local assessors to be the total taxable value of land and additions on the property. | Land | Improvement |
|---|---|---|---|---|
| 2025 | $1,110 | $31,499 | $5,454 | $26,045 |
| 2024 | $1,110 | $31,025 | $4,887 | $26,138 |
| 2023 | $1,110 | $28,339 | $4,887 | $23,452 |
| 2022 | $936 | $24,591 | $4,256 | $20,335 |
| 2021 | $875 | $22,916 | $4,256 | $18,660 |
| 2020 | $880 | $23,973 | $4,256 | $19,717 |
| 2019 | $855 | $23,135 | $4,256 | $18,879 |
| 2018 | $832 | $21,736 | $4,256 | $17,480 |
| 2017 | $822 | $21,711 | $3,878 | $17,833 |
| 2016 | $799 | $20,899 | $3,878 | $17,021 |
| 2015 | $619 | $20,114 | $3,262 | $16,852 |
| 2014 | $619 | $21,125 | $4,603 | $16,522 |
Source: Public Records
Map
Nearby Homes
Your Personal Tour Guide
Ask me questions while you tour the home.