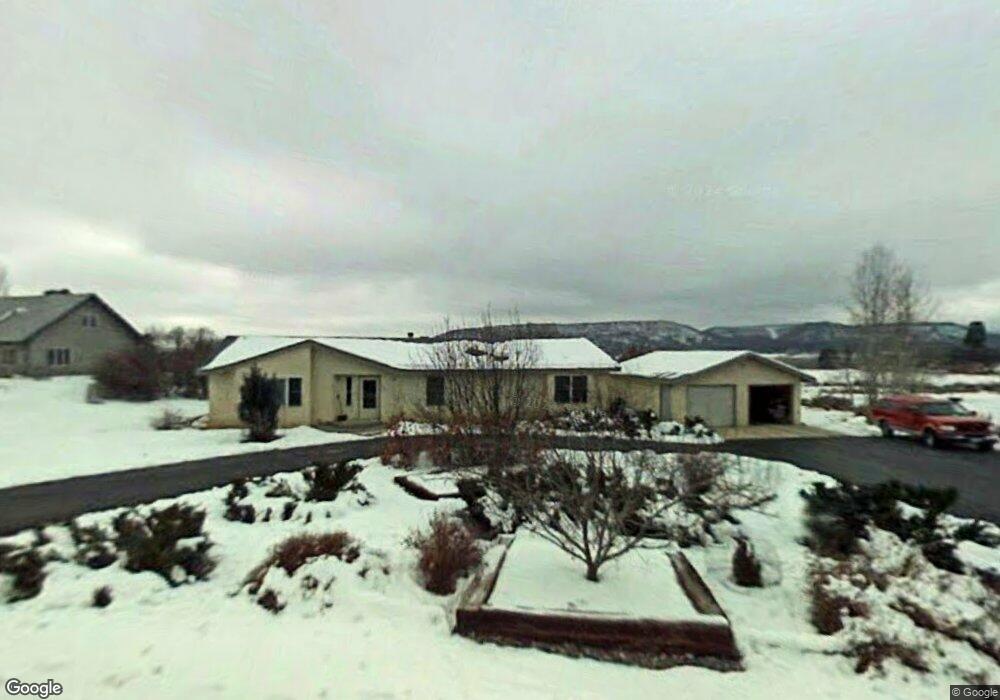
1455 N Mountain View Dr Bayfield, CO 81122
Estimated Value: $506,114 - $564,000
3
Beds
2
Baths
1,814
Sq Ft
$291/Sq Ft
Est. Value
About This Home
This home is located at 1455 N Mountain View Dr, Bayfield, CO 81122 and is currently estimated at $528,779, approximately $291 per square foot. 1455 N Mountain View Dr is a home located in La Plata County with nearby schools including Bayfield Elementary School, Bayfield Middle School, and Bayfield High School.
Ownership History
Date
Name
Owned For
Owner Type
Purchase Details
Closed on
Jul 1, 2024
Sold by
Beckler Michael C
Bought by
Hubbs Holly Keith
Current Estimated Value
Home Financials for this Owner
Home Financials are based on the most recent Mortgage that was taken out on this home.
Original Mortgage
$275,000
Outstanding Balance
$271,734
Interest Rate
7.02%
Mortgage Type
New Conventional
Estimated Equity
$257,045
Purchase Details
Closed on
Jul 29, 2017
Sold by
Beckler Tonia S
Bought by
Beckler Michael C
Purchase Details
Closed on
Aug 13, 2013
Sold by
Marinsek Karl and Marinsek Carol A
Bought by
Beckler Michael C and Beckler Tonia S
Home Financials for this Owner
Home Financials are based on the most recent Mortgage that was taken out on this home.
Original Mortgage
$232,000
Interest Rate
4.34%
Mortgage Type
New Conventional
Create a Home Valuation Report for This Property
The Home Valuation Report is an in-depth analysis detailing your home's value as well as a comparison with similar homes in the area
Home Values in the Area
Average Home Value in this Area
Purchase History
| Date | Buyer | Sale Price | Title Company |
|---|---|---|---|
| Hubbs Holly Keith | $475,000 | Land Title | |
| Beckler Michael C | -- | None Available | |
| Beckler Michael C | $290,000 | Land Title |
Source: Public Records
Mortgage History
| Date | Status | Borrower | Loan Amount |
|---|---|---|---|
| Open | Hubbs Holly Keith | $275,000 | |
| Previous Owner | Beckler Michael C | $232,000 |
Source: Public Records
Tax History
| Year | Tax Paid | Tax Assessment Tax Assessment Total Assessment is a certain percentage of the fair market value that is determined by local assessors to be the total taxable value of land and additions on the property. | Land | Improvement |
|---|---|---|---|---|
| 2025 | $1,723 | $31,550 | $8,580 | $22,970 |
| 2024 | $1,576 | $25,150 | $5,740 | $19,410 |
| 2023 | $1,576 | $28,840 | $6,580 | $22,260 |
| 2022 | $1,537 | $29,920 | $6,830 | $23,090 |
| 2021 | $1,598 | $24,120 | $6,220 | $17,900 |
| 2020 | $1,531 | $23,790 | $6,010 | $17,780 |
| 2019 | $1,492 | $23,790 | $6,010 | $17,780 |
| 2018 | $1,343 | $21,790 | $5,560 | $16,230 |
| 2016 | $1,369 | $22,060 | $5,870 | $16,190 |
Source: Public Records
Map
Nearby Homes
- 915 N Wilmer Dr
- 517 Dove Ranch Rd
- 758 E Cedar Dr
- 1711 N Taylor Cir Unit 3
- 1168 N Oak Dr
- 1277 Cr 501
- 120 Senica St
- 1400 Kremer Dr Unit 7
- 325 Star Crossing Unit 2
- 270 Sunflower Ln
- 292 Sunflower Ln
- 324 Sunflower Ln
- 364 Sunflower Ln
- 115 Wild Horse Dr
- 448 Cherry St
- 116 Wild Horse Dr
- 120 Wild Horse Dr
- 118 Wild Horse Dr
- 113 Wild Horse Dr
- 114 Wild Horse Dr
- 1455 Mountain View Dr
- 1415 Mountain View Dr
- 1495 N Mountain View Dr
- 1495 N Mountain View Dr
- 1355 N Mountain View Dr
- 1410 Mountain View Dr
- 1355 Mountain View Dr
- 1515 N Mountain View Dr
- 1450 Mountain View Dr
- 1515 Mountain View Dr
- 1315 Mountain View Dr
- 515 Wilmer Dr
- 970 Wilmer Dr
- 1555 N Mountain View Dr
- 715 Wilmer Dr
- 695 Wilmer Dr
- 1295 N Mountain View Dr
- 795 Wilmer Dr
- 510 Wilmer Dr
- 815 Wilmer Dr
Your Personal Tour Guide
Ask me questions while you tour the home.