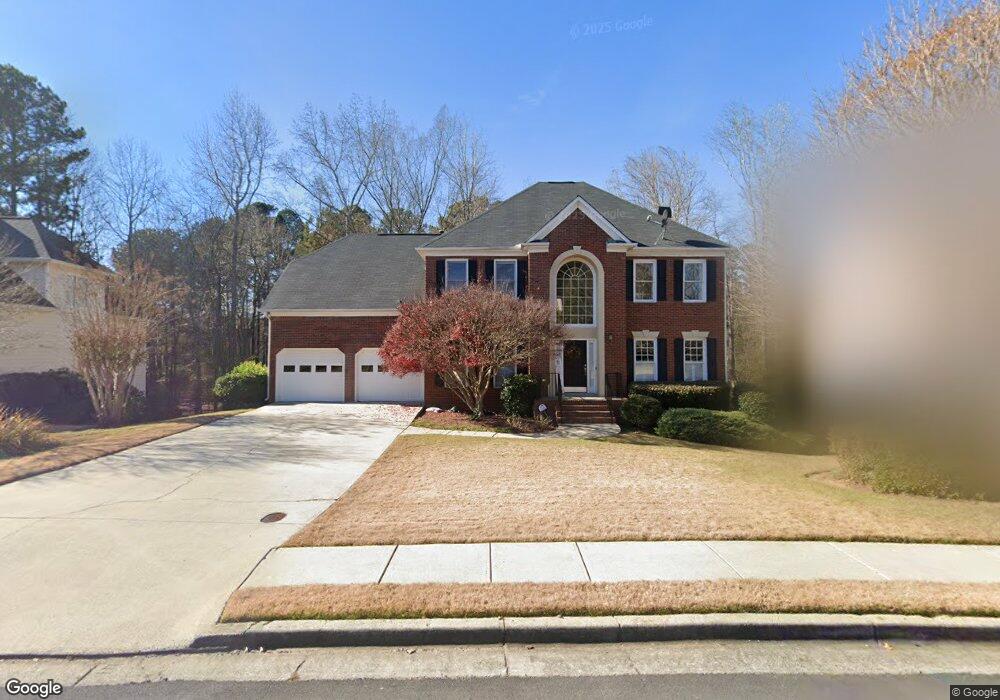
1455 Richards Cir Unit 2 Alpharetta, GA 30009
Estimated Value: $815,000 - $1,188,000
4
Beds
3
Baths
3,186
Sq Ft
$289/Sq Ft
Est. Value
About This Home
This home is located at 1455 Richards Cir Unit 2, Alpharetta, GA 30009 and is currently estimated at $921,292, approximately $289 per square foot. 1455 Richards Cir Unit 2 is a home located in Fulton County with nearby schools including Alpharetta Elementary School, Northwestern Middle School, and Milton High School.
Ownership History
Date
Name
Owned For
Owner Type
Purchase Details
Closed on
Sep 25, 2024
Sold by
Mehta Anuradha
Bought by
Mehta Anuradha and Mehta Narendra
Current Estimated Value
Home Financials for this Owner
Home Financials are based on the most recent Mortgage that was taken out on this home.
Original Mortgage
$563,600
Outstanding Balance
$557,675
Interest Rate
6.35%
Mortgage Type
New Conventional
Estimated Equity
$363,617
Purchase Details
Closed on
Aug 15, 2023
Sold by
Borea Joann Stoffers
Bought by
Mehta Anuradha and Mehta Narendra
Home Financials for this Owner
Home Financials are based on the most recent Mortgage that was taken out on this home.
Original Mortgage
$560,000
Interest Rate
6.78%
Mortgage Type
New Conventional
Purchase Details
Closed on
Mar 1, 2007
Sold by
Borea Joann S
Bought by
Borea Joann S Living Trust
Purchase Details
Closed on
Nov 6, 1996
Sold by
Traton Corp Gwinnett Inc
Bought by
Stoffers Michael D Joann E
Create a Home Valuation Report for This Property
The Home Valuation Report is an in-depth analysis detailing your home's value as well as a comparison with similar homes in the area
Home Values in the Area
Average Home Value in this Area
Purchase History
| Date | Buyer | Sale Price | Title Company |
|---|---|---|---|
| Mehta Anuradha | -- | -- | |
| Mehta Anuradha | $700,000 | -- | |
| Borea Joann Stoffers | -- | -- | |
| Borea Joann S Living Trust | -- | -- | |
| Stoffers Michael D Joann E | $209,500 | -- |
Source: Public Records
Mortgage History
| Date | Status | Borrower | Loan Amount |
|---|---|---|---|
| Open | Mehta Anuradha | $563,600 | |
| Previous Owner | Borea Joann Stoffers | $560,000 | |
| Closed | Stoffers Michael D Joann E | $0 |
Source: Public Records
Tax History Compared to Growth
Tax History
| Year | Tax Paid | Tax Assessment Tax Assessment Total Assessment is a certain percentage of the fair market value that is determined by local assessors to be the total taxable value of land and additions on the property. | Land | Improvement |
|---|---|---|---|---|
| 2025 | $1,610 | $327,800 | $63,160 | $264,640 |
| 2023 | $1,610 | $250,160 | $70,320 | $179,840 |
| 2022 | $6,048 | $229,880 | $46,880 | $183,000 |
| 2021 | $5,313 | $195,840 | $34,880 | $160,960 |
| 2020 | $5,116 | $184,080 | $34,320 | $149,760 |
| 2019 | $0 | $167,040 | $38,400 | $128,640 |
| 2018 | $4,604 | $163,120 | $37,480 | $125,640 |
| 2017 | $4,696 | $160,960 | $39,120 | $121,840 |
| 2016 | $4,697 | $160,960 | $39,120 | $121,840 |
| 2015 | $5,642 | $160,960 | $39,120 | $121,840 |
| 2014 | $3,893 | $127,000 | $25,560 | $101,440 |
Source: Public Records
Map
Nearby Homes
- 265 Dania Dr
- 1045 Mayfield Manor Dr
- 1320 Mayfield Manor Dr Unit 3
- 1438 Salem Dr
- 3051 Maple Ln
- 1845 Evergreen Ln
- 1880 Mayfield Rd
- 3016 Steeplechase Unit 3
- 3018 Steeplechase
- 170 Mayfield Cir
- 355 Heritage Ln Unit 1
- 362 Mayfield Cir
- 785 Briars Bend
- 1810 Broadwell Oaks Dr
- 205 Mayfield Cir
- 3058 Steeplechase Unit 4
- 3052 Steeplechase
- 1445 Richards Cir Unit 2
- 1445 Richards Cir
- 1465 Richards Cir Unit 2
- 1475 Richards Cir
- 1385 Mayfield Manor Dr
- 3000 Vance Ct
- 1375 Mayfield Manor Dr Unit 3
- 1435 Richards Cir
- 1365 Mayfield Manor Dr
- 0 Richards Cir Unit 7288675
- 0 Richards Cir Unit 7115586
- 0 Richards Cir Unit 8807654
- 0 Richards Cir Unit 8018990
- 0 Richards Cir Unit 8008796
- 3010 Vance Ct Unit 2
- 1485 Richards Cir
- 295 Dania Dr
- 1430 Richards Cir
- 2010 Benson Ct
- 285 Dania Dr