Estimated Value: $184,045 - $310,000
2
Beds
1
Bath
984
Sq Ft
$244/Sq Ft
Est. Value
About This Home
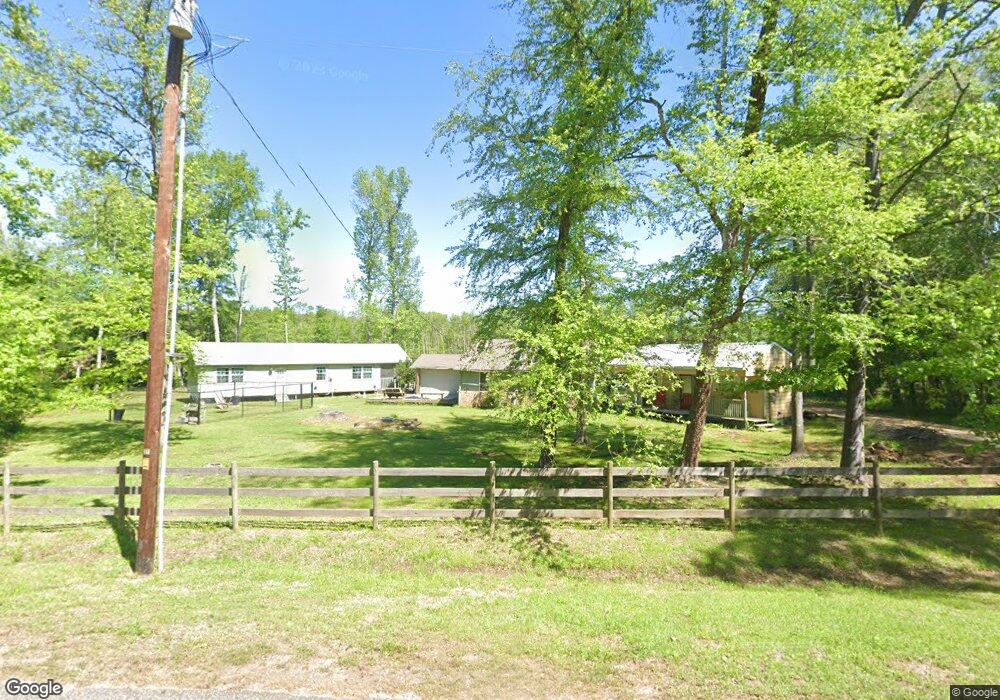
This home is located at 14551 County Road 2215, Tyler, TX 75707 and is currently estimated at $240,511, approximately $244 per square foot. 14551 County Road 2215 is a home located in Smith County with nearby schools including Kissam Intermediate School, Jackson Elementary School, and Chapel Hill Middle School.
Create a Home Valuation Report for This Property
The Home Valuation Report is an in-depth analysis detailing your home's value as well as a comparison with similar homes in the area
Home Values in the Area
Average Home Value in this Area
Tax History Compared to Growth
Tax History
| Year | Tax Paid | Tax Assessment Tax Assessment Total Assessment is a certain percentage of the fair market value that is determined by local assessors to be the total taxable value of land and additions on the property. | Land | Improvement |
|---|---|---|---|---|
| 2025 | $949 | $129,906 | $43,223 | $86,683 |
| 2024 | $949 | $118,938 | $32,547 | $88,147 |
| 2023 | $742 | $155,041 | $32,547 | $122,494 |
| 2022 | $1,572 | $136,147 | $29,321 | $106,826 |
| 2021 | $1,523 | $89,359 | $29,321 | $60,038 |
| 2020 | $1,550 | $87,357 | $29,321 | $58,036 |
| 2019 | $1,469 | $79,340 | $29,321 | $50,019 |
| 2018 | $1,353 | $78,270 | $29,321 | $48,949 |
| 2017 | $1,236 | $66,665 | $17,716 | $48,949 |
| 2016 | $1,167 | $62,904 | $17,716 | $45,188 |
| 2015 | $903 | $60,140 | $17,716 | $42,424 |
| 2014 | $903 | $58,613 | $17,716 | $40,897 |
Source: Public Records
Map
Nearby Homes
- TBD Cr 214
- 10114 C R 272
- TBD Cr 2337 Lot 4
- 14032 Eastside Rd
- 13557 Arizona Dr
- to be determine County Road 2337
- 15471 Tucson Oaks Dr
- 13662 County Road 2241
- 15042 Canopy Oaks Dr
- 14271 Northwest Rd
- 13200 County Road 285
- 14615 County Road 2337
- 15208 County Road 285
- 13190 County Road 285
- 15253 State Highway 64 E
- 15212 Maple Leaf Ct
- 0000 State Highway 64
- 14664 Jade Forest Trail
- 13259 County Road 2220
- 15360 Lakeside Dr
- 14585 County Road 2215
- 14501 County Rd 2215
- 14631 County Road 2215
- 14586 County Road 2215
- 13573 County Road 285
- 14596 County Road 2215
- 13561 County Road 285
- 14632 County Road 2215
- 13575 County Road 285
- 13642 County Road 285
- 13687 Eastside Rd
- 13654 County Road 285
- 13654 13654 C R 285
- 13653 County Road 285
- 14670 County Road 2215
- 13659 County Road 285
- 14949 County Road 2215
- 14829 County Road 2215
- 14945 County Road 2215
- 0000 County Road 2215