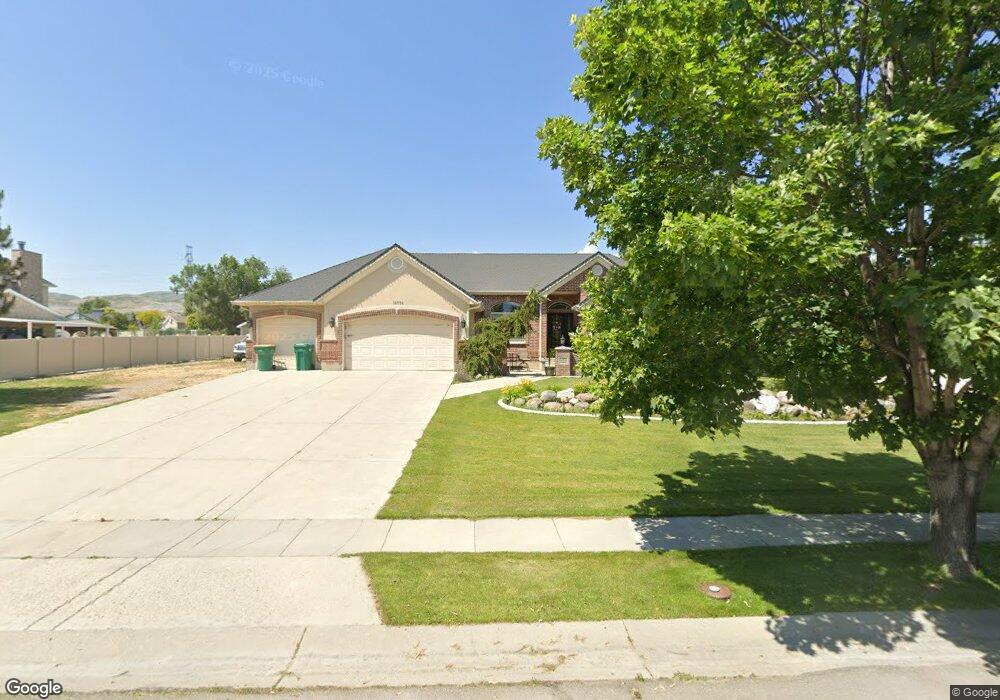
14554 Valley Crest Way Riverton, UT 84065
Estimated Value: $926,000 - $1,142,000
4
Beds
4
Baths
2,040
Sq Ft
$519/Sq Ft
Est. Value
About This Home
This home is located at 14554 Valley Crest Way, Riverton, UT 84065 and is currently estimated at $1,059,643, approximately $519 per square foot. 14554 Valley Crest Way is a home located in Salt Lake County with nearby schools including Bluffdale School, Hidden Valley Middle School, and Riverton High School.
Ownership History
Date
Name
Owned For
Owner Type
Purchase Details
Closed on
Oct 24, 2024
Sold by
Sharon G Cowley Revocable Trust and Cowley Jerry
Bought by
Cowley Steven
Current Estimated Value
Purchase Details
Closed on
Aug 7, 2015
Sold by
Cowley Sharon G
Bought by
Cowley Sharon G and Sharon G Cowley Revocable Trust
Purchase Details
Closed on
Feb 24, 2004
Sold by
Cowley Steven P and Cowley Kristine
Bought by
Cowley Thomas W and Cowley Sharon G
Purchase Details
Closed on
Feb 9, 2000
Sold by
Cowley Steven P
Bought by
Cowley Steven P and Cowley Kristine
Home Financials for this Owner
Home Financials are based on the most recent Mortgage that was taken out on this home.
Original Mortgage
$195,000
Interest Rate
9%
Purchase Details
Closed on
Apr 2, 1998
Sold by
Shadow Mountain Estates
Bought by
Cowley Steve and Cowley Kristine
Create a Home Valuation Report for This Property
The Home Valuation Report is an in-depth analysis detailing your home's value as well as a comparison with similar homes in the area
Home Values in the Area
Average Home Value in this Area
Purchase History
| Date | Buyer | Sale Price | Title Company |
|---|---|---|---|
| Cowley Steven | -- | None Listed On Document | |
| Cowley Steven | -- | None Listed On Document | |
| Cowley Sharon G | -- | None Available | |
| Cowley Thomas W | -- | Surety Title | |
| Cowley Steven P | -- | Associated Title | |
| Cowley Steven P | -- | Associated Title | |
| Cowley Steve | -- | -- |
Source: Public Records
Mortgage History
| Date | Status | Borrower | Loan Amount |
|---|---|---|---|
| Previous Owner | Cowley Steven P | $195,000 |
Source: Public Records
Tax History Compared to Growth
Tax History
| Year | Tax Paid | Tax Assessment Tax Assessment Total Assessment is a certain percentage of the fair market value that is determined by local assessors to be the total taxable value of land and additions on the property. | Land | Improvement |
|---|---|---|---|---|
| 2025 | $3,907 | $867,000 | $513,100 | $353,900 |
| 2024 | $3,907 | $800,200 | $402,300 | $397,900 |
| 2023 | $4,144 | $784,700 | $394,300 | $390,400 |
| 2022 | $4,510 | $785,900 | $386,600 | $399,300 |
| 2021 | $3,547 | $577,000 | $287,200 | $289,800 |
| 2020 | $3,346 | $509,600 | $262,200 | $247,400 |
| 2019 | $3,217 | $478,300 | $247,400 | $230,900 |
| 2018 | $2,873 | $440,000 | $247,400 | $192,600 |
| 2017 | $2,881 | $422,000 | $247,400 | $174,600 |
| 2016 | $3,068 | $424,700 | $247,400 | $177,300 |
| 2015 | $3,162 | $421,900 | $257,300 | $164,600 |
| 2014 | $3,058 | $390,400 | $240,000 | $150,400 |
Source: Public Records
Map
Nearby Homes
- 14534 S 2700 W
- 2859 Country Classic Dr
- 2973 W 14865 S
- 14371 S Jayden Mae Dr Unit 21
- 14593 S 3400 W
- 14332 S Keely Ct Unit 12
- 14277 Keely Ct
- 14553 S 3400 W
- 15048 S 2815 W
- 3297 W Blue Springs Ln
- 3411 W Boulden Blvd
- 15118 S 2815 W
- 15093 S Pastoral Way
- 14956 S Castle Valley Dr
- 7851 W High Canyon Rd
- 13364 S Tree House Ln W Unit 2
- 15093 Maradona Dr
- 15751 S High Step Ln
- Millcreek Plan at Harvest Gardens - Villas
- 14617 S King Quail Way W Unit 5
- 14570 Valley Crest Way
- 14538 S Valley Crest Way
- 14522 S Valley Crest Way
- 14522 Valley Crest Way
- 14584 S Valley Crest Way
- 14584 Valley Crest Way
- 14547 Valley Crest Way
- 14612 S Ten Sleep Cir
- 14571 Valley Crest Way
- 14571 S Valley Crest Way
- 14498 Valley Crest Way
- 14498 S Valley Crest Way
- 14525 Valley Crest Way
- 14525 S Valley Crest Way
- 14612 Ten Sleep Cir
- 14572 S Ten Sleep Cir
- 14604 S Valley Crest Way
- 14624 S Ten Sleep Cir
- 14624 S Ten Sleep Cir
- 14587 Valley Crest Way