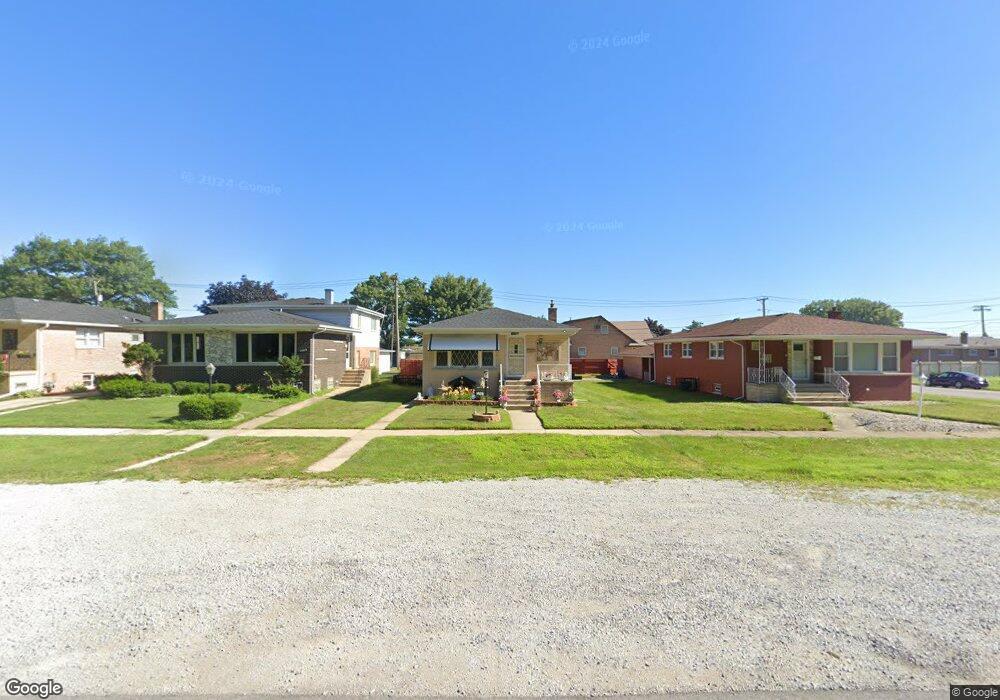
1456 Pulaski Rd Calumet City, IL 60409
Estimated Value: $170,000 - $240,000
3
Beds
2
Baths
1,156
Sq Ft
$167/Sq Ft
Est. Value
About This Home
This home is located at 1456 Pulaski Rd, Calumet City, IL 60409 and is currently estimated at $193,446, approximately $167 per square foot. 1456 Pulaski Rd is a home located in Cook County with nearby schools including Diekman Elementary School, Carol Moseley Braun School, and Creative Communications Academy.
Ownership History
Date
Name
Owned For
Owner Type
Purchase Details
Closed on
Feb 3, 2011
Sold by
Us Bank National Association
Bought by
Lopez Olivia R
Current Estimated Value
Purchase Details
Closed on
Aug 5, 2010
Sold by
Robinson Robyn A and Robinson Robyn
Bought by
Us Bank National Association
Purchase Details
Closed on
Jun 23, 1998
Sold by
Tatum Robert
Bought by
Robinson Robyn A
Home Financials for this Owner
Home Financials are based on the most recent Mortgage that was taken out on this home.
Original Mortgage
$112,048
Interest Rate
7.17%
Mortgage Type
FHA
Purchase Details
Closed on
Aug 28, 1997
Sold by
Declarati Mccarthy James P
Bought by
Tatum Robert
Purchase Details
Closed on
Sep 7, 1996
Sold by
Mccarthy Jennie
Bought by
Declarati Mccarthy James and Jennie Mccarthy 1996 Declaration Of Tr
Create a Home Valuation Report for This Property
The Home Valuation Report is an in-depth analysis detailing your home's value as well as a comparison with similar homes in the area
Home Values in the Area
Average Home Value in this Area
Purchase History
| Date | Buyer | Sale Price | Title Company |
|---|---|---|---|
| Lopez Olivia R | $43,000 | Attorneys Title Guaranty Fun | |
| Us Bank National Association | -- | None Available | |
| Robinson Robyn A | $113,000 | Professional National Title | |
| Tatum Robert | $49,666 | -- | |
| Declarati Mccarthy James | -- | -- |
Source: Public Records
Mortgage History
| Date | Status | Borrower | Loan Amount |
|---|---|---|---|
| Previous Owner | Robinson Robyn A | $112,048 |
Source: Public Records
Tax History Compared to Growth
Tax History
| Year | Tax Paid | Tax Assessment Tax Assessment Total Assessment is a certain percentage of the fair market value that is determined by local assessors to be the total taxable value of land and additions on the property. | Land | Improvement |
|---|---|---|---|---|
| 2024 | $6,672 | $12,351 | $2,063 | $10,288 |
| 2023 | $5,117 | $14,001 | $2,063 | $11,938 |
| 2022 | $5,117 | $9,885 | $1,781 | $8,104 |
| 2021 | $4,887 | $9,885 | $1,781 | $8,104 |
| 2020 | $5,281 | $10,872 | $1,781 | $9,091 |
| 2019 | $2,740 | $7,141 | $1,500 | $5,641 |
| 2018 | $4,138 | $9,065 | $1,500 | $7,565 |
| 2017 | $4,009 | $9,065 | $1,500 | $7,565 |
| 2016 | $4,234 | $8,844 | $1,406 | $7,438 |
| 2015 | $4,053 | $8,844 | $1,406 | $7,438 |
| 2014 | $3,980 | $8,844 | $1,406 | $7,438 |
| 2013 | $4,492 | $10,193 | $1,406 | $8,787 |
Source: Public Records
Map
Nearby Homes
- 615 Hoxie Ave
- 605 Hoxie Ave
- 605 Saginaw Ave
- 618 Marquette Ave
- 678 Muskegon Ave
- 1225 Memorial Dr
- 627 Paxton Ave
- 508 Hoxie Ave
- 1758 Memorial Dr
- 558 Muskegon Ave
- 518 Crandon Ave
- 1863 Michigan City Rd Unit 1W
- 602 Merrill Ave
- 590 Exchange Ave
- 453 Hoxie Ave
- 669 Chappel Ave Unit 2C
- 452 Yates Ave
- 15435 Merrill Ave
- 1918 Stonegate Dr
- 1076 156th Place
- 1460 Pulaski Rd
- 1460 Pulaski Rd
- 1452 Pulaski Rd
- 1462 Pulaski Rd
- 676 Hoxie Ave
- 676 Hoxie Ave
- 1472 Pulaski Rd
- 675 Calhoun Ave
- 1474 Pulaski Rd
- 1424 Pulaski Rd
- 1424 Pulaski Rd
- 666 Hoxie Ave
- 671 Calhoun Ave
- 677 Hoxie Ave
- 660 Hoxie Ave
- 663 Calhoun Ave
- 663 Calhoun Ave
- 669 Hoxie Ave
- 1500 Pulaski Rd
- 1500 Pulaski Rd