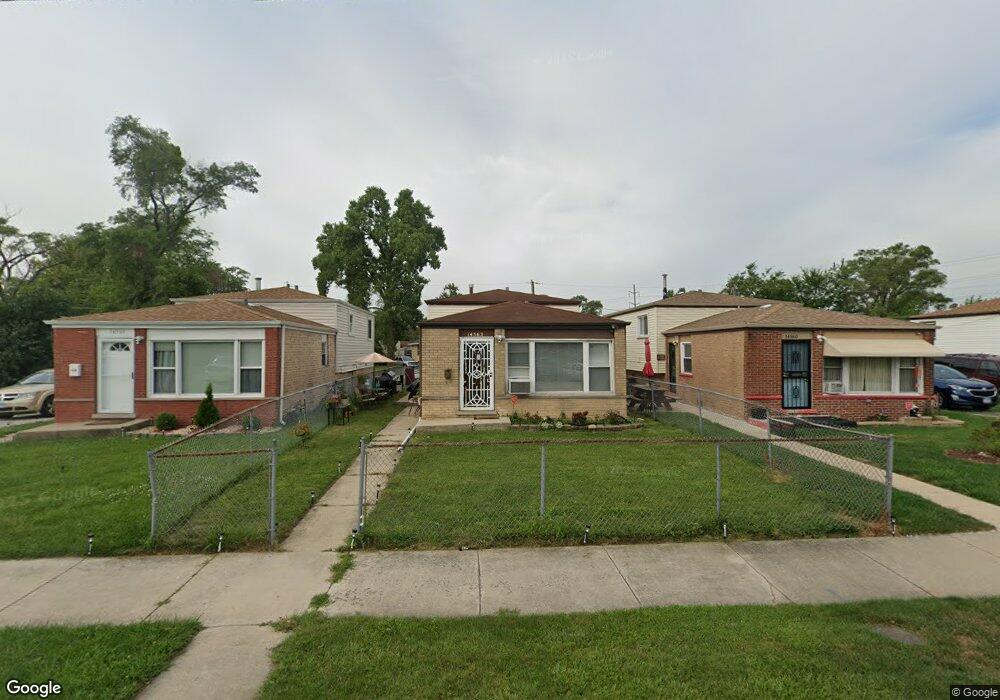
14562 Spaulding Ave Harvey, IL 60426
Estimated Value: $108,465 - $155,000
3
Beds
2
Baths
919
Sq Ft
$145/Sq Ft
Est. Value
About This Home
This home is located at 14562 Spaulding Ave, Harvey, IL 60426 and is currently estimated at $133,616, approximately $145 per square foot. 14562 Spaulding Ave is a home located in Cook County with nearby schools including Thornton Township High School and Academic Mastery Academy.
Ownership History
Date
Name
Owned For
Owner Type
Purchase Details
Closed on
Oct 11, 2023
Sold by
Kuruvilla Prakash
Bought by
Vega Manuel Mendez and Gonzalez Cristina Garcia
Current Estimated Value
Purchase Details
Closed on
Dec 9, 2011
Sold by
Matthews Elouise
Bought by
Kuruvilla Prakash
Purchase Details
Closed on
Jul 26, 2002
Sold by
New Cities Community Development Corp
Bought by
Matthews Eloise
Home Financials for this Owner
Home Financials are based on the most recent Mortgage that was taken out on this home.
Original Mortgage
$61,750
Interest Rate
9.39%
Purchase Details
Closed on
Jun 19, 2001
Sold by
Fifth Third Bank
Bought by
Waterford Nya
Purchase Details
Closed on
Sep 11, 1998
Sold by
Pinnacle Bank
Bought by
New Cities Community Development Corp
Purchase Details
Closed on
Dec 29, 1993
Sold by
Sheahan Michael F
Bought by
Hud
Create a Home Valuation Report for This Property
The Home Valuation Report is an in-depth analysis detailing your home's value as well as a comparison with similar homes in the area
Home Values in the Area
Average Home Value in this Area
Purchase History
| Date | Buyer | Sale Price | Title Company |
|---|---|---|---|
| Vega Manuel Mendez | $65,000 | Fidelity National Title | |
| Kuruvilla Prakash | $18,000 | Fidelity National Title | |
| Matthews Eloise | $65,000 | Stewart Title | |
| Waterford Nya | $49,500 | -- | |
| New Cities Community Development Corp | -- | -- | |
| Hud | -- | -- |
Source: Public Records
Mortgage History
| Date | Status | Borrower | Loan Amount |
|---|---|---|---|
| Previous Owner | Matthews Eloise | $61,750 |
Source: Public Records
Tax History Compared to Growth
Tax History
| Year | Tax Paid | Tax Assessment Tax Assessment Total Assessment is a certain percentage of the fair market value that is determined by local assessors to be the total taxable value of land and additions on the property. | Land | Improvement |
|---|---|---|---|---|
| 2024 | $6,161 | $12,000 | $920 | $11,080 |
| 2023 | $1,027 | $12,000 | $920 | $11,080 |
| 2022 | $1,027 | $4,606 | $920 | $3,686 |
| 2021 | $1,080 | $4,606 | $920 | $3,686 |
| 2020 | $1,236 | $4,606 | $920 | $3,686 |
| 2019 | $1,244 | $4,964 | $828 | $4,136 |
| 2018 | $1,200 | $4,964 | $828 | $4,136 |
| 2017 | $1,227 | $4,964 | $828 | $4,136 |
| 2016 | $2,501 | $5,959 | $736 | $5,223 |
| 2015 | $2,319 | $5,959 | $736 | $5,223 |
| 2014 | $2,344 | $5,959 | $736 | $5,223 |
| 2013 | $2,394 | $6,386 | $736 | $5,650 |
Source: Public Records
Map
Nearby Homes
- 14564 Spaulding Ave
- 14727 Wood St
- 14806 Lincoln Ave
- 14514 Cooper Ave
- 14826 Robey Ave
- 14807 Paulina St
- 14245 Lincoln Ave
- 14425 Vail Ave
- 14910 S Wood St
- 14921 Lincoln Ave
- 14839 Cooper Ave
- 14525 Oakley St
- 14911 Page Ave
- 147 W 150th St
- 14913 Leavitt Ave
- 110 W 150th St
- 14924 Leavitt Ave
- 15012 Seeley Ave
- 15032 Winchester Ave
- 14735 Myrtle Ave
- 14560 Spaulding Ave
- 14554 Spaulding Ave
- 14601 Winchester Ave
- 14604 Lincoln Ave
- 14604 Lincoln Ave
- 14548 Spaulding Ave
- 14607 Winchester Ave
- 145 W 146th St
- 14609 Winchester Ave
- 14611 Winchester Ave
- 14542 Spaulding Ave
- 147 W 146th St
- 14613 Winchester Ave
- 14540 Spaulding Ave
- 149 W 146th St
- 14606 Winchester Ave
- 14615 Winchester Ave
- 14538 Spaulding Ave
- 14608 Winchester Ave
- 14534 Spaulding Ave