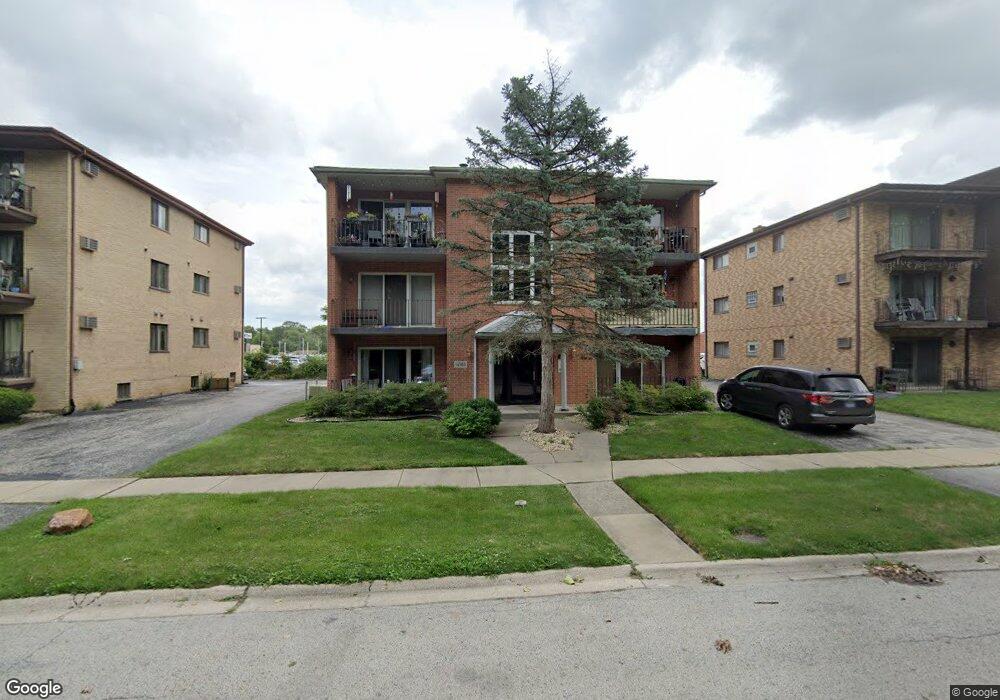
14565 Lamon Ave Unit 3S Midlothian, IL 60445
Estimated Value: $136,260 - $159,000
2
Beds
2
Baths
1,000
Sq Ft
$147/Sq Ft
Est. Value
About This Home
This home is located at 14565 Lamon Ave Unit 3S, Midlothian, IL 60445 and is currently estimated at $146,565, approximately $146 per square foot. 14565 Lamon Ave Unit 3S is a home located in Cook County with nearby schools including Kerkstra Elementary School, Jack Hille Middle School, and Oak Forest High School.
Ownership History
Date
Name
Owned For
Owner Type
Purchase Details
Closed on
Sep 19, 2003
Sold by
Barnes Walter L and Barnes Darilyn J
Bought by
Wall Jennifer
Current Estimated Value
Home Financials for this Owner
Home Financials are based on the most recent Mortgage that was taken out on this home.
Original Mortgage
$88,800
Outstanding Balance
$39,152
Interest Rate
5.87%
Mortgage Type
Unknown
Estimated Equity
$107,413
Purchase Details
Closed on
Oct 27, 2000
Sold by
Garbaciak John R and Garbaciak Margaret M
Bought by
Barnes Walter and Barnes Darilyn
Home Financials for this Owner
Home Financials are based on the most recent Mortgage that was taken out on this home.
Original Mortgage
$88,250
Interest Rate
7.86%
Mortgage Type
FHA
Purchase Details
Closed on
Dec 5, 1997
Sold by
Backstrom Arthur
Bought by
Backstrom Arthur G and Backstrom Gerald
Create a Home Valuation Report for This Property
The Home Valuation Report is an in-depth analysis detailing your home's value as well as a comparison with similar homes in the area
Home Values in the Area
Average Home Value in this Area
Purchase History
| Date | Buyer | Sale Price | Title Company |
|---|---|---|---|
| Wall Jennifer | $111,000 | Multiple | |
| Barnes Walter | $91,000 | -- | |
| Backstrom Arthur G | -- | -- |
Source: Public Records
Mortgage History
| Date | Status | Borrower | Loan Amount |
|---|---|---|---|
| Open | Wall Jennifer | $88,800 | |
| Previous Owner | Barnes Walter | $88,250 | |
| Closed | Wall Jennifer | $22,200 |
Source: Public Records
Tax History
| Year | Tax Paid | Tax Assessment Tax Assessment Total Assessment is a certain percentage of the fair market value that is determined by local assessors to be the total taxable value of land and additions on the property. | Land | Improvement |
|---|---|---|---|---|
| 2025 | $2,713 | $10,880 | $817 | $10,063 |
| 2024 | $2,713 | $10,880 | $817 | $10,063 |
| 2023 | $3,024 | $10,879 | $816 | $10,063 |
| 2022 | $3,024 | $9,943 | $675 | $9,268 |
| 2021 | $2,980 | $9,942 | $674 | $9,268 |
| 2020 | $2,955 | $9,942 | $674 | $9,268 |
| 2019 | $2,271 | $8,645 | $603 | $8,042 |
| 2018 | $2,223 | $8,645 | $603 | $8,042 |
| 2017 | $2,179 | $8,645 | $603 | $8,042 |
| 2016 | $2,253 | $7,754 | $532 | $7,222 |
| 2015 | $2,149 | $7,754 | $532 | $7,222 |
| 2014 | $2,107 | $7,754 | $532 | $7,222 |
| 2013 | $2,561 | $9,715 | $532 | $9,183 |
Source: Public Records
Map
Nearby Homes
- 14641 Lavergne Ave
- 14411 Lamon Ave
- 14409 Lamon Ave
- 14506 Knox Ave
- 14602 Kenton Ave
- 14340 Kilpatrick Ave
- 14725 Laramie Ave
- 14913 Sheila Ct
- 14448 Kilbourne Ave
- 14348 Kolmar Ave
- 14927 Kenton Ave
- 14144 Kilpatrick Ave
- 14632 Kostner Ave
- 14545 Kostner Ave
- 14540 Kolin Ave
- 14528 Kolin Ave
- 14601 Linder Ave
- 14244 Kostner Ave
- 15201 Lavergne Ave
- 14401 Kolin Ave
- 14565 Lamon Ave Unit 3N
- 14565 Lamon Ave Unit 1S
- 14565 Lamon Ave Unit 2S
- 14565 Lamon Ave Unit 1N
- 14565 Lamon Ave Unit 2N
- 14557 Lamon Ave
- 14557 Lamon Ave
- 14557 Lamon Ave Unit 1N
- 14627 Lamon Ave
- 14547 Lamon Ave Unit 3N
- 14547 Lamon Ave
- 14600 Lamon Ave
- 14631 Lamon Ave Unit 2-S
- 14631 Lamon Ave Unit 2-N
- 14631 Lamon Ave
- 14618 Lamon Ave
- 14625 Laporte Ave
- 14635 Lamon Ave
- 14533 Lamon Ave Unit 302
Your Personal Tour Guide
Ask me questions while you tour the home.