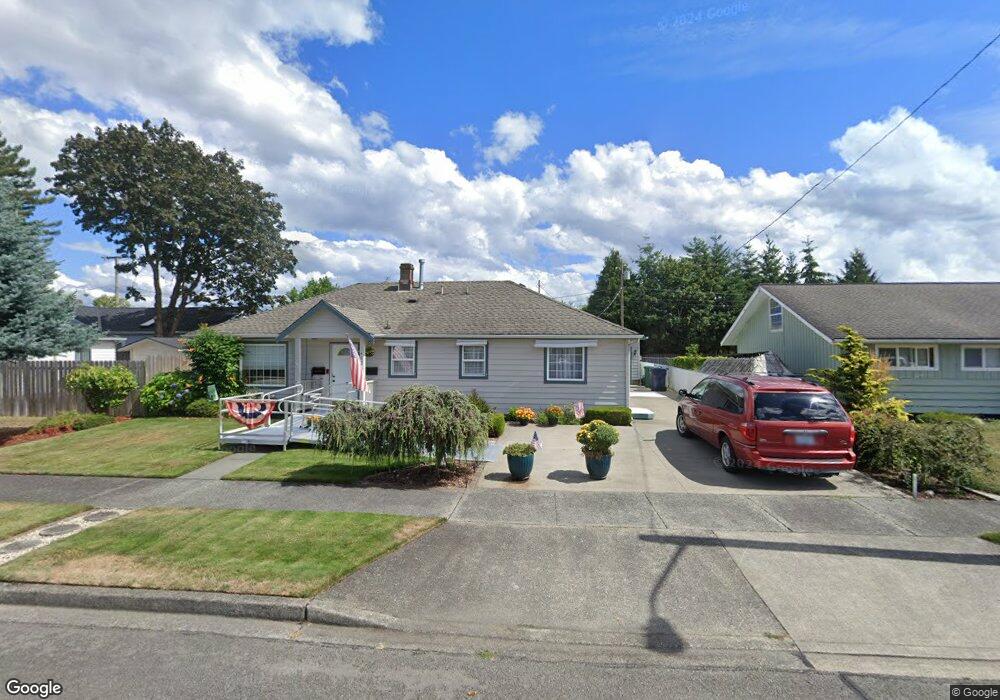
1457 Garfield St Enumclaw, WA 98022
Estimated Value: $489,000 - $550,000
3
Beds
2
Baths
1,570
Sq Ft
$330/Sq Ft
Est. Value
About This Home
This home is located at 1457 Garfield St, Enumclaw, WA 98022 and is currently estimated at $517,701, approximately $329 per square foot. 1457 Garfield St is a home located in King County with nearby schools including Sunrise Elementary School, Enumclaw Middle School, and Enumclaw Senior High School.
Ownership History
Date
Name
Owned For
Owner Type
Purchase Details
Closed on
Dec 27, 2021
Sold by
Rutter Mary Ellen
Bought by
Gourdine Jeanna Marie
Current Estimated Value
Home Financials for this Owner
Home Financials are based on the most recent Mortgage that was taken out on this home.
Original Mortgage
$437,000
Outstanding Balance
$402,060
Interest Rate
2.98%
Mortgage Type
New Conventional
Estimated Equity
$115,641
Purchase Details
Closed on
Sep 19, 2006
Sold by
Fasoli Steven A and Fasoli Koren
Bought by
Rutter Mary Ellen
Purchase Details
Closed on
Mar 12, 1998
Sold by
Malast Ronald M and Malast Lone J
Bought by
Fasoli Steven A
Home Financials for this Owner
Home Financials are based on the most recent Mortgage that was taken out on this home.
Original Mortgage
$96,000
Interest Rate
7.06%
Purchase Details
Closed on
Jan 5, 1993
Sold by
Volimer Loretta
Bought by
Malast_Ronald M & Lone J
Create a Home Valuation Report for This Property
The Home Valuation Report is an in-depth analysis detailing your home's value as well as a comparison with similar homes in the area
Home Values in the Area
Average Home Value in this Area
Purchase History
| Date | Buyer | Sale Price | Title Company |
|---|---|---|---|
| Gourdine Jeanna Marie | $487,000 | Chicago Title | |
| Rutter Mary Ellen | $276,000 | Stewart Title | |
| Fasoli Steven A | $108,000 | First American Title | |
| Malast_Ronald M & Lone J | $92,000 | -- |
Source: Public Records
Mortgage History
| Date | Status | Borrower | Loan Amount |
|---|---|---|---|
| Open | Gourdine Jeanna Marie | $437,000 | |
| Previous Owner | Fasoli Steven A | $96,000 |
Source: Public Records
Tax History
| Year | Tax Paid | Tax Assessment Tax Assessment Total Assessment is a certain percentage of the fair market value that is determined by local assessors to be the total taxable value of land and additions on the property. | Land | Improvement |
|---|---|---|---|---|
| 2024 | $3,578 | $372,500 | $114,000 | $258,500 |
| 2022 | $3,325 | $365,400 | $113,000 | $252,400 |
Source: Public Records
Map
Nearby Homes
- 1722 Harding St
- 1720 Garfield St Unit 4
- 2881 Initial Ave
- 1705 Marshall Ave
- 1234 Lincoln Ave Unit A
- 1234 Lincoln Ave Unit B
- 2054 Roosevelt Ave
- 1730 Hillcrest Ave
- 1966 Wilson Ave
- 1975 Wilson Ave
- 1107 Griffin Ave
- 3189 Roosevelt Ave
- 1909 Highpoint St
- 3183 Roosevelt Ave
- 3249 Lois Ln
- 620 Myrtine St
- 2921 Frederickson St
- 650 Mckinley St
- 522 Harmony Ln
- 1170 Cedar Dr
- 1439 Garfield St
- 2346 Initial Ave
- 2336 Initial Ave
- 1456 Harding St
- 1421 Garfield St
- 1446 Harding St
- 2314 Initial Ave
- 1458 Garfield St
- 1446 Garfield St
- 1472 Garfield St
- 1428 Harding St
- 1432 Garfield St
- 2343 Initial Ave
- 2343 Stevenson Ave
- 1506 Harding St
- 1414 Garfield St
- 2309 Stevenson Ave
- 1523 Garfield St
- 1459 Loraine St
Your Personal Tour Guide
Ask me questions while you tour the home.