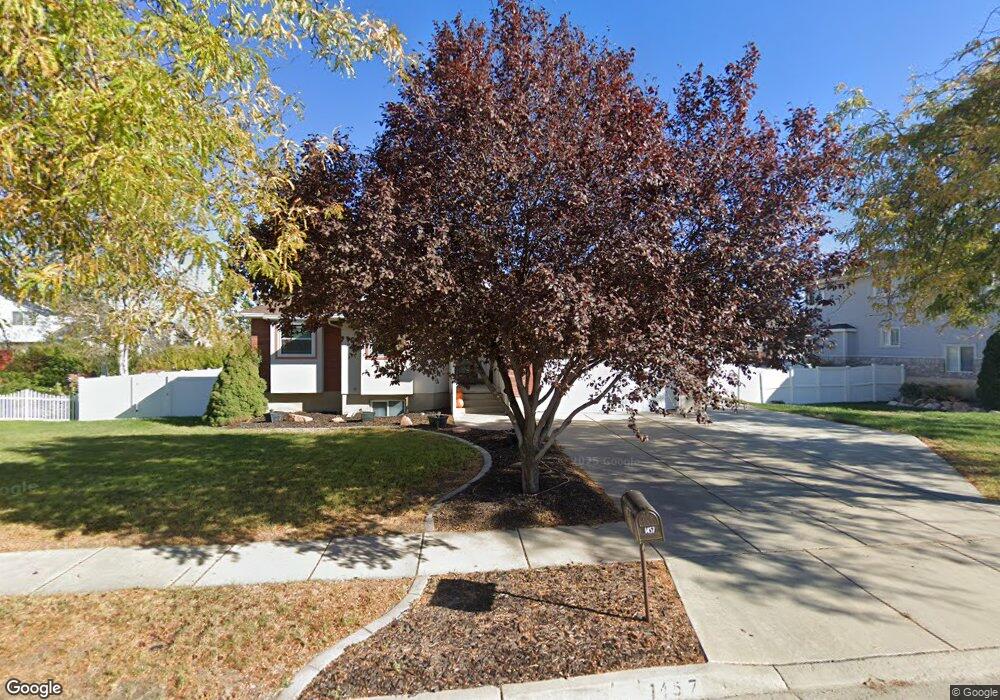
1457 Gleneagles Dr Syracuse, UT 84075
Estimated Value: $526,000 - $571,000
3
Beds
2
Baths
1,466
Sq Ft
$374/Sq Ft
Est. Value
About This Home
This home is located at 1457 Gleneagles Dr, Syracuse, UT 84075 and is currently estimated at $548,011, approximately $373 per square foot. 1457 Gleneagles Dr is a home located in Davis County with nearby schools including Buffalo Point School, Syracuse Junior High School, and Syracuse High School.
Ownership History
Date
Name
Owned For
Owner Type
Purchase Details
Closed on
Apr 27, 2001
Sold by
Monsen Ryan L and Monsen Lecia
Bought by
Monsen Ryan L and Monsen Lecia D
Current Estimated Value
Home Financials for this Owner
Home Financials are based on the most recent Mortgage that was taken out on this home.
Original Mortgage
$186,200
Outstanding Balance
$68,129
Interest Rate
6.92%
Estimated Equity
$479,882
Purchase Details
Closed on
Jan 30, 1997
Sold by
Calute Homes Inc
Bought by
Monsen Ryan L and Monsen Lecia
Home Financials for this Owner
Home Financials are based on the most recent Mortgage that was taken out on this home.
Original Mortgage
$155,750
Interest Rate
7.74%
Purchase Details
Closed on
May 29, 1996
Sold by
Blackburn Jones Real Estate Inc
Bought by
Calute Homes Inc
Create a Home Valuation Report for This Property
The Home Valuation Report is an in-depth analysis detailing your home's value as well as a comparison with similar homes in the area
Home Values in the Area
Average Home Value in this Area
Purchase History
| Date | Buyer | Sale Price | Title Company |
|---|---|---|---|
| Monsen Ryan L | -- | Backman Stewart Title Servic | |
| Monsen Ryan L | -- | First American Title Co | |
| Calute Homes Inc | -- | First American Title Co |
Source: Public Records
Mortgage History
| Date | Status | Borrower | Loan Amount |
|---|---|---|---|
| Open | Monsen Ryan L | $186,200 | |
| Closed | Monsen Ryan L | $155,750 |
Source: Public Records
Tax History Compared to Growth
Tax History
| Year | Tax Paid | Tax Assessment Tax Assessment Total Assessment is a certain percentage of the fair market value that is determined by local assessors to be the total taxable value of land and additions on the property. | Land | Improvement |
|---|---|---|---|---|
| 2025 | $2,685 | $259,050 | $107,507 | $151,543 |
| 2024 | $2,576 | $250,250 | $84,759 | $165,491 |
| 2023 | $2,531 | $448,000 | $130,137 | $317,863 |
| 2022 | $2,732 | $265,100 | $64,533 | $200,567 |
| 2021 | $2,364 | $355,000 | $94,165 | $260,835 |
| 2020 | $1,987 | $289,000 | $75,194 | $213,806 |
| 2019 | $1,895 | $272,000 | $79,428 | $192,572 |
| 2018 | $1,755 | $250,000 | $77,517 | $172,483 |
| 2016 | $1,586 | $118,525 | $32,777 | $85,748 |
| 2015 | $1,549 | $110,220 | $32,777 | $77,443 |
| 2014 | $1,383 | $100,323 | $32,777 | $67,546 |
| 2013 | -- | $103,259 | $31,123 | $72,136 |
Source: Public Records
Map
Nearby Homes
- 2840 W 1200 S
- 1441 Brookshire Dr
- 2982 S 3000 W
- 2912 S 3000 W
- 2679 W Antelope Dr
- 3627 W Augusta Dr
- 3564 Princeville Dr
- 1641 S 2350 W Unit B
- 3579 W 1775 S
- 2655 S 2430 W Unit 120
- 2665 S 2430 W Unit 118
- 2655 S 2430 W Unit 116
- 2633 S 2430 W Unit 113
- 2614 S 2430 W Unit 106
- 2663 S 2430 W
- 1918 S 2465 W
- 3736 W 1225 S
- 851 S 3525 W
- 4344 W 1825 S Unit 102
- 4354 W 1825 S Unit 104
- 1456 S 3000 W
- 1439 Gleneagles Dr
- 1438 S 3000 W
- 1474 Gleneagles Dr
- 1474 S 3000 W
- 1454 Gleneagles Dr
- 1470 Gleneagles Dr
- 1421 Gleneagles Dr
- 1487 Gleneagles Dr
- 1487 Gleneagles Dr Unit 9
- 1436 Gleneagles Dr
- 1420 S 3000 W
- 1492 S 3000 W
- 1492 Gleneagles Dr
- 1486 Gleneagles Dr
- 1422 Gleneagles Dr
- 1403 Gleneagles Dr
- 1509 Gleneagles Dr
- 1402 S 3000 W
- 1508 S 3050 W