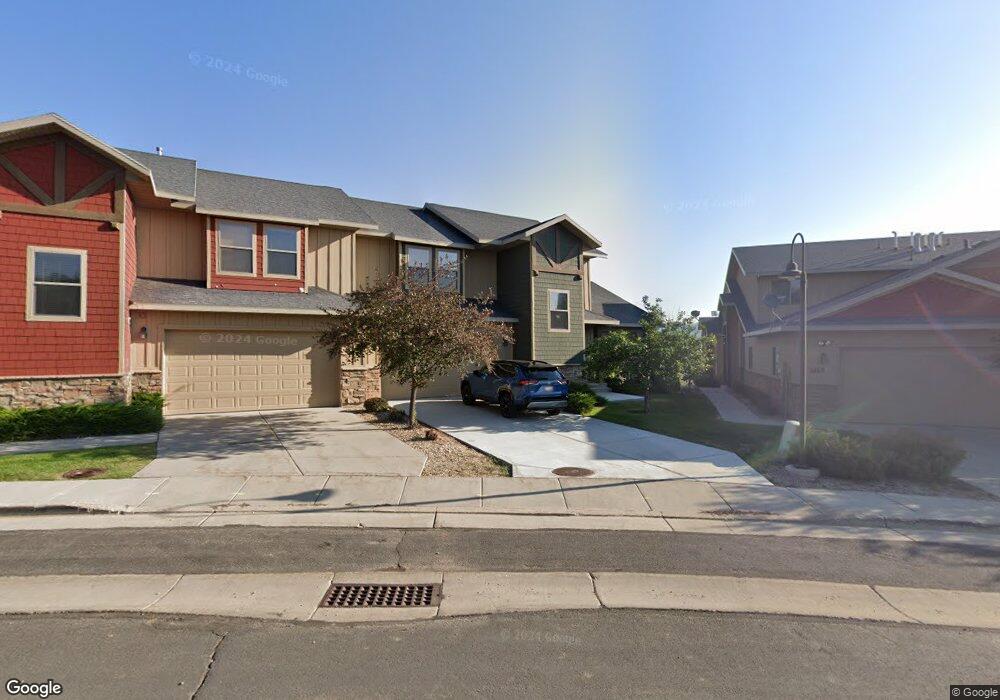
1457 W Stillwater Dr Unit 10 Heber City, UT 84032
Estimated Value: $1,473,000 - $1,785,381
6
Beds
4
Baths
4,130
Sq Ft
$396/Sq Ft
Est. Value
About This Home
This home is located at 1457 W Stillwater Dr Unit 10, Heber City, UT 84032 and is currently estimated at $1,636,345, approximately $396 per square foot. 1457 W Stillwater Dr Unit 10 is a home located in Wasatch County with nearby schools including Midway Elementary School, Rocky Mountain Middle School, and Wasatch High School.
Ownership History
Date
Name
Owned For
Owner Type
Purchase Details
Closed on
Oct 15, 2024
Sold by
Clyne Matthew and Clyne Sherri G
Bought by
Matthew J Clyne Revocable Trust and Sherri G Clyne Revocable Trust
Current Estimated Value
Purchase Details
Closed on
Feb 7, 2023
Sold by
Beverly A And Alan G Robinson Family Tru
Bought by
Clyne Matthew and Clyne Sherri G
Home Financials for this Owner
Home Financials are based on the most recent Mortgage that was taken out on this home.
Original Mortgage
$947,625
Interest Rate
6.38%
Mortgage Type
New Conventional
Purchase Details
Closed on
Aug 2, 2007
Sold by
Robinson Alan G and Robinson Beverly A
Bought by
Robinson Alan G and Robinson Beverly A
Purchase Details
Closed on
Aug 22, 2005
Sold by
Bnb Development Llc
Bought by
Robinson Alan G and Robinson Beverly A
Create a Home Valuation Report for This Property
The Home Valuation Report is an in-depth analysis detailing your home's value as well as a comparison with similar homes in the area
Home Values in the Area
Average Home Value in this Area
Purchase History
| Date | Buyer | Sale Price | Title Company |
|---|---|---|---|
| Matthew J Clyne Revocable Trust | -- | None Listed On Document | |
| Clyne Matthew | -- | Metro National Title | |
| Robinson Alan G | -- | Brighton Title | |
| Robinson Alan G | -- | Brighton Title |
Source: Public Records
Mortgage History
| Date | Status | Borrower | Loan Amount |
|---|---|---|---|
| Previous Owner | Clyne Matthew | $947,625 |
Source: Public Records
Tax History Compared to Growth
Tax History
| Year | Tax Paid | Tax Assessment Tax Assessment Total Assessment is a certain percentage of the fair market value that is determined by local assessors to be the total taxable value of land and additions on the property. | Land | Improvement |
|---|---|---|---|---|
| 2025 | $12,997 | $1,520,777 | $270,000 | $1,250,777 |
| 2024 | $10,966 | $1,293,040 | $260,000 | $1,033,040 |
| 2023 | $10,966 | $1,469,400 | $235,000 | $1,234,400 |
| 2022 | $5,612 | $601,986 | $60,000 | $541,986 |
| 2021 | $7,044 | $601,986 | $60,000 | $541,986 |
| 2020 | $7,264 | $601,986 | $60,000 | $541,986 |
| 2019 | $6,772 | $601,986 | $0 | $0 |
| 2018 | $6,772 | $601,986 | $0 | $0 |
| 2017 | $6,312 | $561,839 | $0 | $0 |
| 2016 | $3,792 | $330,846 | $0 | $0 |
| 2015 | $3,571 | $330,846 | $60,000 | $270,846 |
| 2014 | $3,744 | $330,846 | $60,000 | $270,846 |
Source: Public Records
Map
Nearby Homes
- 1364 Still Water Dr Unit 3103
- 1364 Still Water Dr Unit 1093
- 1364 Still Water Dr Unit R1085
- 1364 W Stillwater Dr Unit R3093
- 1364 W Stillwater Dr Unit R3080
- 1364 W Stillwater Dr Unit R2080
- 1364 W Stillwater Dr Unit R3097
- 1364 W Stillwater Dr Unit R2097
- 1364 W Stillwater Dr Unit R1105
- 1364 W Stillwater Dr Unit R1090
- 1364 W Stillwater Dr Unit 2088
- 1364 W Stillwater Dr Unit R2091
- 1364 W Stillwater Dr Unit R2115
- 1364 W Stillwater Dr Unit 3103
- 1364 W Stillwater Dr Unit R2090
- 1364 W Stillwater Dr Unit R114
- 1364 W Stillwater Dr Unit R1084
- 1364 W Stillwater Dr Unit 3093
- 1364 W Stillwater Dr Unit R1080
- 1364 W Stillwater Dr Unit 3101
- 1457 W Stillwater Dr
- 1457 Still Water Dr
- 1463 Still Water Dr Unit ID1247066P
- 1455 Still Water Dr
- 1455 Still Water Dr Unit 9
- 1455 Stillwater Dr Unit 9
- 1463 W Stillwater Dr Unit 11
- 1463 W Stillwater Dr
- 1465 Still Water Dr
- 1465 W Stillwater Dr Unit 12
- 1465 W Stillwater Dr
- 13642049 W Stillwater Dr Unit 2049
- 1449 W Stillwater Dr Unit 8
- 1471 W Stillwater Dr Unit 13
- 1471 W Stillwater Dr
- 1473 Still Water Dr
- 1473 Stillwater Dr Unit 14
- 1426 Hailstone Dr Unit Lot 31
- 1426 Hailstone Dr
- 1434 Hailstone Dr Unit 1434