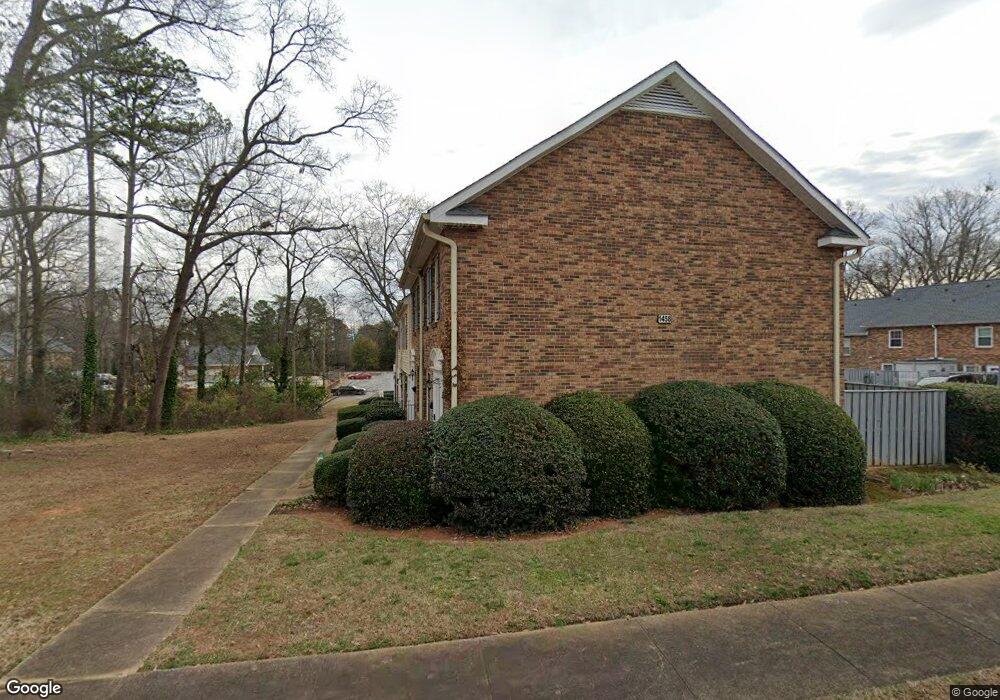
1458 Dover Rd Unit 1458D Spartanburg, SC 29301
Wadsworth Hills NeighborhoodEstimated Value: $113,000 - $126,452
2
Beds
2
Baths
1,008
Sq Ft
$120/Sq Ft
Est. Value
About This Home
This home is located at 1458 Dover Rd Unit 1458D, Spartanburg, SC 29301 and is currently estimated at $120,613, approximately $119 per square foot. 1458 Dover Rd Unit 1458D is a home located in Spartanburg County with nearby schools including Dorman High School Freshman Campus, Dorman High School, and Fine Arts Preparatory School.
Ownership History
Date
Name
Owned For
Owner Type
Purchase Details
Closed on
Dec 30, 2022
Sold by
Op Spe Tpa1 Llc
Bought by
Rice Jaquan
Current Estimated Value
Home Financials for this Owner
Home Financials are based on the most recent Mortgage that was taken out on this home.
Original Mortgage
$113,900
Outstanding Balance
$110,355
Interest Rate
6.75%
Mortgage Type
New Conventional
Estimated Equity
$10,258
Purchase Details
Closed on
Jun 28, 2022
Sold by
Danak Daxa V
Bought by
Op Spe Tpa1 Llc
Purchase Details
Closed on
Jul 9, 2014
Sold by
Khan Rumaisa and Rana Haider Z
Bought by
Trivedi Krupa Kavyesh and Danak Daxa
Purchase Details
Closed on
Aug 31, 2009
Sold by
Duvall Robert R
Bought by
Khan Rumaisa and Rana Haider Z
Purchase Details
Closed on
Dec 5, 2008
Sold by
Clapham Jamie Elizabeth Crowe
Bought by
Duvall Robert R
Purchase Details
Closed on
Oct 31, 2003
Sold by
Duvall Robert R
Bought by
Clapham Jamie Elizabeth Crowe
Create a Home Valuation Report for This Property
The Home Valuation Report is an in-depth analysis detailing your home's value as well as a comparison with similar homes in the area
Home Values in the Area
Average Home Value in this Area
Purchase History
| Date | Buyer | Sale Price | Title Company |
|---|---|---|---|
| Rice Jaquan | $113,900 | -- | |
| Rice Jaquan | $113,900 | -- | |
| Op Spe Tpa1 Llc | $106,000 | None Listed On Document | |
| Op Spe Tpa1 Llc | $106,000 | None Listed On Document | |
| Trivedi Krupa Kavyesh | $34,000 | -- | |
| Khan Rumaisa | $35,000 | -- | |
| Duvall Robert R | $34,000 | -- | |
| Clapham Jamie Elizabeth Crowe | $41,000 | -- |
Source: Public Records
Mortgage History
| Date | Status | Borrower | Loan Amount |
|---|---|---|---|
| Open | Rice Jaquan | $113,900 | |
| Closed | Rice Jaquan | $113,900 |
Source: Public Records
Tax History Compared to Growth
Tax History
| Year | Tax Paid | Tax Assessment Tax Assessment Total Assessment is a certain percentage of the fair market value that is determined by local assessors to be the total taxable value of land and additions on the property. | Land | Improvement |
|---|---|---|---|---|
| 2025 | $3,094 | $6,834 | $606 | $6,228 |
| 2024 | $3,094 | $6,834 | $606 | $6,228 |
| 2023 | $3,094 | $6,834 | $606 | $6,228 |
| 2022 | $1,282 | $2,460 | $420 | $2,040 |
| 2021 | $1,203 | $2,277 | $389 | $1,888 |
| 2020 | $1,192 | $2,277 | $389 | $1,888 |
| 2019 | $1,192 | $2,277 | $389 | $1,888 |
| 2018 | $1,192 | $2,277 | $349 | $1,928 |
| 2017 | $1,048 | $1,980 | $420 | $1,560 |
| 2016 | $1,041 | $1,980 | $420 | $1,560 |
| 2015 | $1,028 | $1,980 | $420 | $1,560 |
| 2014 | $489 | $1,320 | $280 | $1,040 |
Source: Public Records
Map
Nearby Homes
- 1460 Dover Rd Unit A
- 208 Saint Matthews Ln
- 1391 W O Ezell Blvd
- 415 W Parima Ct
- 413 W Parima Ct
- 121 Dover Rd
- 206 Collingwood Ln
- 411 W Parima Ct
- 409 W Parima Ct
- Litchfield Plan at El Dorado
- Corner Litchfield Plan at El Dorado
- 407 W Parima Ct
- 512 E Parima Ave
- 196 Ellington Dr
- 409 Melbourne Ln
- 102 Wake Robin Cir
- 114 Milo Rd
- 1458 Dover Rd Unit F
- 1458 Dover Rd Unit C
- 1458 Dover Rd Unit B
- 1458 Dover Rd Unit F
- 1458 Dover Rd Unit A
- 1458 Dover Rd
- 1458 Dover Rd Unit D
- 1458 Dover #B Rd
- 1458 Dover Rd
- 1458 Dover Rd Unit F
- 1458 Dover Rd
- 1456 Dover Rd
- 1456 Dover Rd Unit F
- 1456 Dover Rd Unit 1456D
- 1456 Dover Rd Unit A
- 1456 Dover Rd Unit B
- 1456 Dover Rd Unit C
- 1456 Dover Rd
- 1462 Dover Rd Unit B
- 1462 Dover Rd Unit A