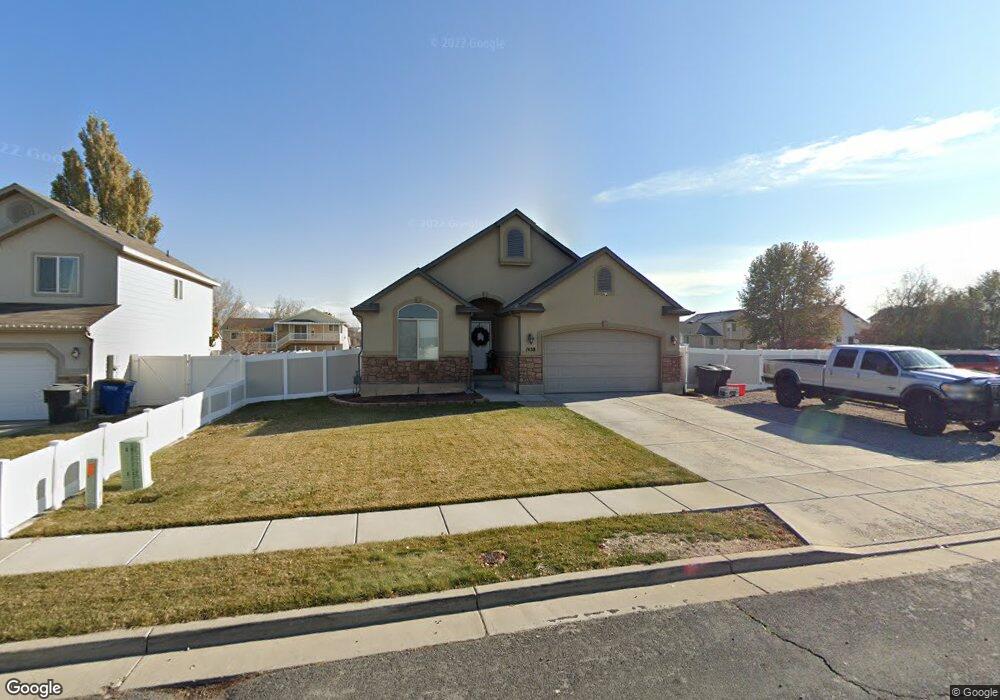
1458 N 2340 W Clearfield, UT 84015
Estimated Value: $527,000 - $576,000
5
Beds
3
Baths
2,890
Sq Ft
$190/Sq Ft
Est. Value
About This Home
This home is located at 1458 N 2340 W, Clearfield, UT 84015 and is currently estimated at $547,864, approximately $189 per square foot. 1458 N 2340 W is a home located in Davis County with nearby schools including West Clinton Elementary School, West Point Junior High School, and Syracuse High School.
Ownership History
Date
Name
Owned For
Owner Type
Purchase Details
Closed on
May 13, 2020
Sold by
Peat Austin and Peat Flor
Bought by
Johnson Gary L and Johnson Anne
Current Estimated Value
Purchase Details
Closed on
Mar 26, 2018
Sold by
Lancaster Earl S
Bought by
Peat Austin and Peat Flor
Home Financials for this Owner
Home Financials are based on the most recent Mortgage that was taken out on this home.
Original Mortgage
$191,468
Interest Rate
4.56%
Mortgage Type
FHA
Purchase Details
Closed on
May 10, 2007
Sold by
Gmw Development Inc
Bought by
Lancaster Earl S
Home Financials for this Owner
Home Financials are based on the most recent Mortgage that was taken out on this home.
Original Mortgage
$243,386
Interest Rate
6.14%
Mortgage Type
VA
Create a Home Valuation Report for This Property
The Home Valuation Report is an in-depth analysis detailing your home's value as well as a comparison with similar homes in the area
Home Values in the Area
Average Home Value in this Area
Purchase History
| Date | Buyer | Sale Price | Title Company |
|---|---|---|---|
| Johnson Gary L | -- | First American Titl | |
| Peat Austin | -- | -- | |
| Lancaster Earl S | -- | Cottonwood Title Ins Agency |
Source: Public Records
Mortgage History
| Date | Status | Borrower | Loan Amount |
|---|---|---|---|
| Previous Owner | Peat Austin | $191,468 | |
| Previous Owner | Lancaster Earl S | $243,386 |
Source: Public Records
Tax History Compared to Growth
Tax History
| Year | Tax Paid | Tax Assessment Tax Assessment Total Assessment is a certain percentage of the fair market value that is determined by local assessors to be the total taxable value of land and additions on the property. | Land | Improvement |
|---|---|---|---|---|
| 2025 | $2,957 | $284,350 | $93,543 | $190,807 |
| 2024 | $2,839 | $274,449 | $101,999 | $172,450 |
| 2023 | $2,673 | $262,900 | $64,623 | $198,276 |
| 2022 | $2,852 | $513,000 | $127,481 | $385,519 |
| 2021 | $2,575 | $378,000 | $90,763 | $287,237 |
| 2020 | $2,244 | $326,000 | $78,748 | $247,252 |
| 2019 | $2,192 | $311,000 | $89,028 | $221,972 |
| 2018 | $1,543 | $264,000 | $74,813 | $189,187 |
| 2016 | $9 | $127,270 | $29,466 | $97,804 |
| 2015 | $1,769 | $121,055 | $29,466 | $91,589 |
| 2014 | $1,692 | $117,662 | $29,466 | $88,196 |
| 2013 | -- | $123,916 | $27,373 | $96,543 |
Source: Public Records
Map
Nearby Homes
- 1458 N 2400 W
- 1449 N 2475 W
- 1509 N 2475 W
- 2371 W 1300 N
- 2148 W 1570 N
- 1694 N 2225 W
- 1251 N 2525 W
- 2642 W 1500 N
- 2259 W 1800 N
- 1665 N 1960 W
- 1923 W 1340 N
- 1331 N 1850 W
- 2616 N 2125 W Unit 147
- 2921 W 1300 N
- 1958 N 2750 W
- 878 N 2600 W
- 2132 W 800 N
- 2816 W 960 N
- 2617 N 2080 W Unit 176
- 3648 W 900 N Unit 207