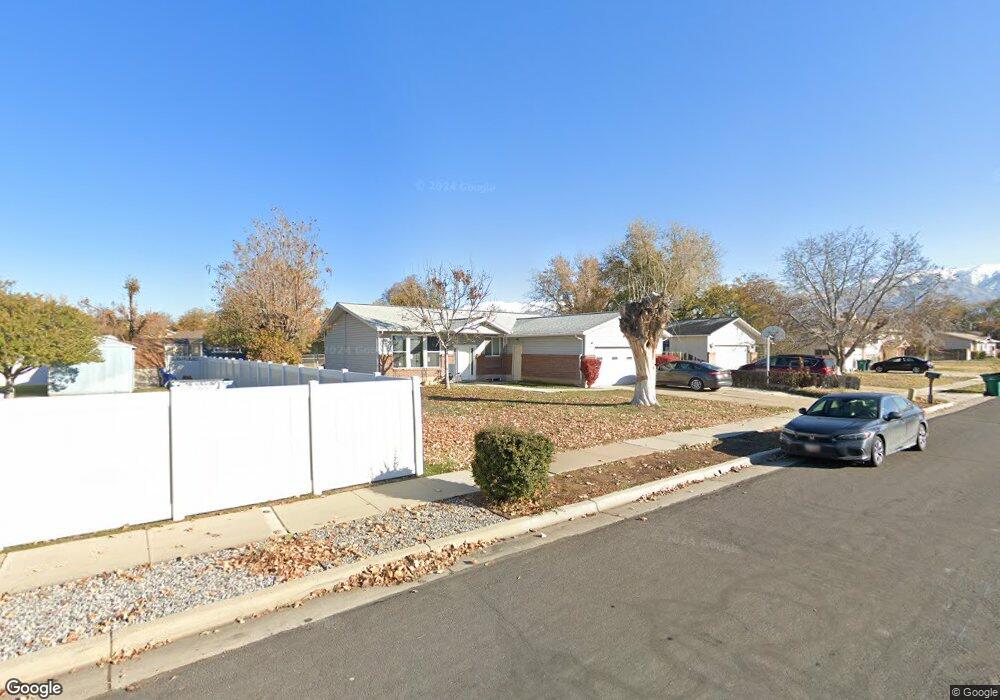
1458 W 1750 N Layton, UT 84041
Estimated Value: $451,000 - $469,714
5
Beds
2
Baths
2,576
Sq Ft
$178/Sq Ft
Est. Value
About This Home
This home is located at 1458 W 1750 N, Layton, UT 84041 and is currently estimated at $459,179, approximately $178 per square foot. 1458 W 1750 N is a home located in Davis County with nearby schools including Vae View Elementary School, North Layton Junior High School, and Northridge High School.
Ownership History
Date
Name
Owned For
Owner Type
Purchase Details
Closed on
Sep 29, 2020
Sold by
Li Jianxin
Bought by
Stander Tyson
Current Estimated Value
Home Financials for this Owner
Home Financials are based on the most recent Mortgage that was taken out on this home.
Original Mortgage
$301,670
Outstanding Balance
$267,712
Interest Rate
2.9%
Mortgage Type
New Conventional
Estimated Equity
$191,467
Purchase Details
Closed on
Mar 19, 2020
Sold by
Bravo Li Aida
Bought by
Li Jianxin
Purchase Details
Closed on
Jun 21, 2018
Sold by
Li Jianxin
Bought by
Bravo Li Aida
Purchase Details
Closed on
May 18, 2018
Sold by
Robinson Rosa B
Bought by
Li Jianxin
Purchase Details
Closed on
Jan 18, 2002
Sold by
Family Trust Earl D & Cheryl C Robinson
Bought by
Robinson Earl D
Purchase Details
Closed on
Jul 26, 1996
Sold by
Robinson Earl D and Robinson Cheryl C
Bought by
Robinson Earl D and Robinson Cheryl C
Create a Home Valuation Report for This Property
The Home Valuation Report is an in-depth analysis detailing your home's value as well as a comparison with similar homes in the area
Home Values in the Area
Average Home Value in this Area
Purchase History
| Date | Buyer | Sale Price | Title Company |
|---|---|---|---|
| Stander Tyson | -- | Inwest Title Services | |
| Li Jianxin | -- | Accommodation | |
| Bravo Li Aida | -- | Pinnacle Title | |
| Li Jianxin | -- | Mountain View Title | |
| Robinson Earl D | -- | -- | |
| Robinson Earl D | -- | -- |
Source: Public Records
Mortgage History
| Date | Status | Borrower | Loan Amount |
|---|---|---|---|
| Open | Stander Tyson | $301,670 |
Source: Public Records
Tax History Compared to Growth
Tax History
| Year | Tax Paid | Tax Assessment Tax Assessment Total Assessment is a certain percentage of the fair market value that is determined by local assessors to be the total taxable value of land and additions on the property. | Land | Improvement |
|---|---|---|---|---|
| 2025 | $2,180 | $228,800 | $105,228 | $123,572 |
| 2024 | $2,226 | $235,400 | $125,611 | $109,789 |
| 2023 | $2,146 | $400,000 | $162,734 | $237,266 |
| 2022 | $2,331 | $235,950 | $76,530 | $159,420 |
| 2021 | $2,160 | $328,000 | $109,186 | $218,814 |
| 2020 | $1,740 | $252,000 | $80,574 | $171,426 |
| 2019 | $1,727 | $245,000 | $77,478 | $167,522 |
| 2018 | $1,510 | $215,000 | $71,739 | $143,261 |
| 2016 | $1,317 | $96,745 | $20,524 | $76,221 |
| 2015 | $1,256 | $87,560 | $20,524 | $67,036 |
| 2014 | $627 | $94,351 | $20,524 | $73,827 |
| 2013 | -- | $82,018 | $18,612 | $63,406 |
Source: Public Records
Map
Nearby Homes
- 1425 W 1650 N
- 1615 N Angel St Unit F
- 1615 N Angel St Unit I
- 1615 N Angel St Unit E
- 1615 N Angel St Unit B
- 1615 N Angel St
- 1615 N Angel St Unit C
- 1615 N Angel St Unit H
- 1615 N Angel St Unit A
- 1615 N Angel St Unit G
- 1615 N Angel St Unit D
- 1094 N Angel St W
- 1748 N 1600 W
- 1740 N 1600 W Unit 116
- 1692 N 1600 W
- 1688 N 1600 W Unit 125
- 1682 N 1600 W
- 1678 N 1600 W
- 1668 N 1600 W
- 1664 N 1600 W