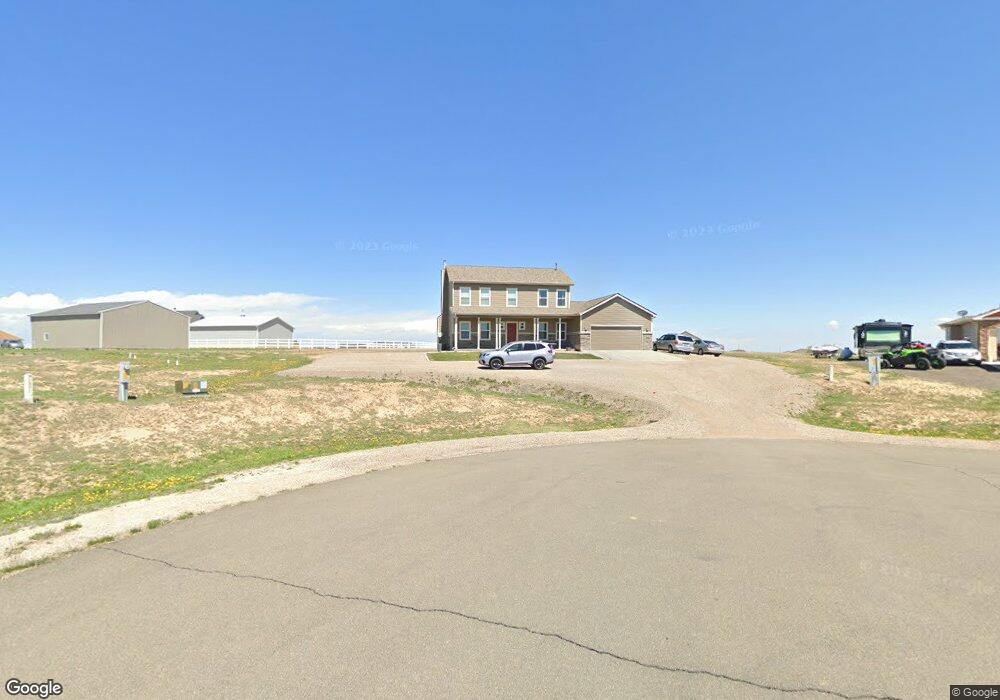
14585 Barksdaly Way Keenesburg, CO 80643
Estimated Value: $670,666 - $774,000
4
Beds
3
Baths
1,940
Sq Ft
$381/Sq Ft
Est. Value
About This Home
This home is located at 14585 Barksdaly Way, Keenesburg, CO 80643 and is currently estimated at $739,417, approximately $381 per square foot. 14585 Barksdaly Way is a home located in Adams County with nearby schools including Pennock Elementary School, Don Riggio, and Overland Trail Middle School.
Ownership History
Date
Name
Owned For
Owner Type
Purchase Details
Closed on
Apr 15, 2016
Sold by
Villanyi Eric
Bought by
Villanyi Eric and Villanyi Karen M
Current Estimated Value
Purchase Details
Closed on
Jul 22, 2015
Sold by
New Expression Homes Llc
Bought by
Villanyi Eric
Home Financials for this Owner
Home Financials are based on the most recent Mortgage that was taken out on this home.
Original Mortgage
$269,504
Outstanding Balance
$211,093
Interest Rate
3.99%
Mortgage Type
FHA
Estimated Equity
$528,324
Purchase Details
Closed on
May 19, 2014
Sold by
Utes Real Estate Company
Bought by
New Expression Homes Llc
Home Financials for this Owner
Home Financials are based on the most recent Mortgage that was taken out on this home.
Original Mortgage
$184,035
Interest Rate
4.32%
Mortgage Type
Construction
Create a Home Valuation Report for This Property
The Home Valuation Report is an in-depth analysis detailing your home's value as well as a comparison with similar homes in the area
Home Values in the Area
Average Home Value in this Area
Purchase History
| Date | Buyer | Sale Price | Title Company |
|---|---|---|---|
| Villanyi Eric | -- | Land Title Guarantee Company | |
| Villanyi Eric | $274,476 | Heritage Title Co | |
| New Expression Homes Llc | $18,000 | Cets |
Source: Public Records
Mortgage History
| Date | Status | Borrower | Loan Amount |
|---|---|---|---|
| Open | Villanyi Eric | $269,504 | |
| Previous Owner | New Expression Homes Llc | $184,035 |
Source: Public Records
Tax History Compared to Growth
Tax History
| Year | Tax Paid | Tax Assessment Tax Assessment Total Assessment is a certain percentage of the fair market value that is determined by local assessors to be the total taxable value of land and additions on the property. | Land | Improvement |
|---|---|---|---|---|
| 2024 | $4,478 | $39,190 | $7,270 | $31,920 |
| 2023 | $4,478 | $43,840 | $6,600 | $37,240 |
| 2022 | $3,981 | $34,580 | $8,480 | $26,100 |
| 2021 | $3,878 | $34,580 | $8,480 | $26,100 |
| 2020 | $3,817 | $33,330 | $8,720 | $24,610 |
| 2019 | $3,820 | $33,330 | $8,720 | $24,610 |
| 2018 | $3,092 | $25,070 | $3,740 | $21,330 |
| 2017 | $3,108 | $25,070 | $3,740 | $21,330 |
| 2016 | $2,574 | $18,400 | $4,140 | $14,260 |
| 2015 | $1,187 | $7,700 | $4,140 | $3,560 |
| 2014 | $522 | $3,460 | $3,460 | $0 |
Source: Public Records
Map
Nearby Homes
- 14545 Barksdaly Way
- 38025 E 145th Place
- 40500 E 144th Ave
- 14855 Almstead St
- 2 Imboden Rd
- TBD E 106th Ave
- Tbd East 136th Ave
- 34308 E 139th Ct
- 0 E 136th Ave & N Schumaker Rd
- 0 Imboden Rd Unit REC3138696
- 0 County Road 55 Rd Unit REC1884965
- 0 County Road 55 Rd Unit REC3356931
- 16590 Watkins Rd
- 12550 Imboden Rd
- 12450 Imboden Rd
- 6816 E 149th Ave
- Tbd County Road 55
- 14771 N Harback Rd
- 31200 E 145th Ave
- 16540 Umpire St
- 0 Cavanugh
- 14550 Barksdaly Way
- 14590 Barksdaly Way
- 14590 Barksdaly Way
- 14560 Avery Way
- 14580 Avery Way
- 14540 Avery Way
- 37960 E 147th Place
- 14520 Avery Way
- 38055 E 145th Place
- 14490 Avery Way
- 14490 Avery Way
- 14531 Avery Way
- 38055 E 145th Ave
- 38000 E 147th Place
- 38000 E 145th Place
- 14571 Avery Way
- 14551 Avery Way
- 38100 E 147th Place
- 37765 E 145th Place