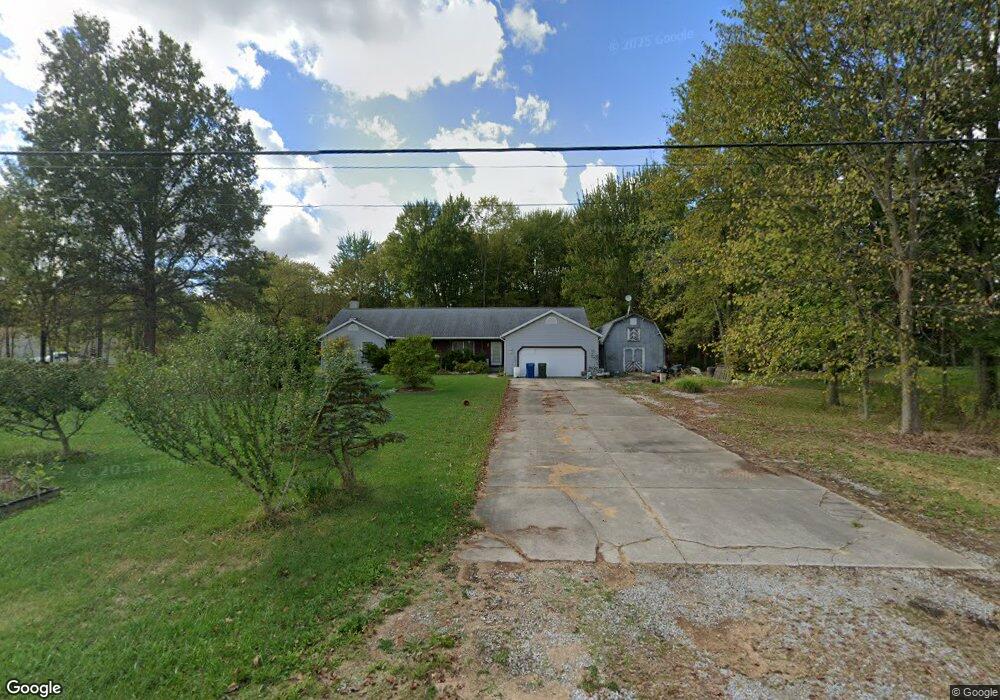
14588 Wheeler Rd Lagrange, OH 44050
Estimated Value: $418,326 - $486,000
2
Beds
3
Baths
2,458
Sq Ft
$188/Sq Ft
Est. Value
About This Home
This home is located at 14588 Wheeler Rd, Lagrange, OH 44050 and is currently estimated at $461,082, approximately $187 per square foot. 14588 Wheeler Rd is a home located in Lorain County with nearby schools including Keystone Elementary School, Keystone Middle School, and Keystone High School.
Ownership History
Date
Name
Owned For
Owner Type
Purchase Details
Closed on
Jul 23, 2022
Sold by
Markosky Sandra L
Bought by
Orchard Trust and Markosky
Current Estimated Value
Purchase Details
Closed on
May 16, 2001
Sold by
Weekley Carol A
Bought by
Markowsky Michael D and Markosky Sandra L
Home Financials for this Owner
Home Financials are based on the most recent Mortgage that was taken out on this home.
Original Mortgage
$171,900
Interest Rate
7.07%
Create a Home Valuation Report for This Property
The Home Valuation Report is an in-depth analysis detailing your home's value as well as a comparison with similar homes in the area
Home Values in the Area
Average Home Value in this Area
Purchase History
| Date | Buyer | Sale Price | Title Company |
|---|---|---|---|
| Orchard Trust | -- | None Listed On Document | |
| Markowsky Michael D | $214,750 | Midland Title |
Source: Public Records
Mortgage History
| Date | Status | Borrower | Loan Amount |
|---|---|---|---|
| Previous Owner | Markowsky Michael D | $171,900 |
Source: Public Records
Tax History
| Year | Tax Paid | Tax Assessment Tax Assessment Total Assessment is a certain percentage of the fair market value that is determined by local assessors to be the total taxable value of land and additions on the property. | Land | Improvement |
|---|---|---|---|---|
| 2024 | $4,516 | $120,145 | $20,601 | $99,544 |
| 2023 | $4,072 | $92,376 | $20,006 | $72,370 |
| 2022 | $4,062 | $92,376 | $20,006 | $72,370 |
| 2021 | $4,063 | $92,376 | $20,006 | $72,370 |
| 2020 | $3,493 | $72,790 | $15,760 | $57,030 |
| 2019 | $3,471 | $72,790 | $15,760 | $57,030 |
| 2018 | $3,386 | $72,790 | $15,760 | $57,030 |
| 2017 | $3,531 | $71,360 | $16,650 | $54,710 |
| 2016 | $3,990 | $71,360 | $16,650 | $54,710 |
| 2015 | $3,983 | $71,360 | $16,650 | $54,710 |
| 2014 | $3,282 | $67,320 | $15,710 | $51,610 |
| 2013 | $3,180 | $67,320 | $15,710 | $51,610 |
Source: Public Records
Map
Nearby Homes
- 40175 Banks Rd
- 40163 Banks Rd
- 829 Robinson Dr
- 801 Willich Ct
- 800 Buckingham Dr
- 13301 Indian Hollow Rd
- 808 Buckingham Dr
- 1033 Parsons Rd Unit 11
- 340 Granger Dr
- 1207 Fox Run
- 1167 Fox Run
- 551 N Main St
- 548 William St
- 567 Vicksburg Ct
- 697 Main St
- 516 Appomattox Ct
- 41341 Ravines Edge Way
- 779 Huron St
- 1088 Novak Rd
- 317 Church St
- 14640 Wheeler Rd
- 40015 Parsons Rd
- 14591 Wheeler Rd
- 40055 Parsons Rd
- 40055 Parsons Rd
- 14625 Wheeler Rd
- 14680 Wheeler Rd
- 14647 Wheeler Rd
- 14661 Wheeler Rd
- 40109 Parsons Rd
- 14720 Wheeler Rd
- 39975 Parsons Rd
- 40116 Parsons Rd
- 40134 Parsons Rd
- 40158 Parsons Rd
- 40094 Parsons Rd
- 14744 Wheeler Rd
- 40183 Parsons Rd
- 14727 Wheeler Rd
- 14768 Wheeler Rd
Your Personal Tour Guide
Ask me questions while you tour the home.