Estimated Value: $264,000 - $454,000
3
Beds
3
Baths
2,098
Sq Ft
$164/Sq Ft
Est. Value
About This Home
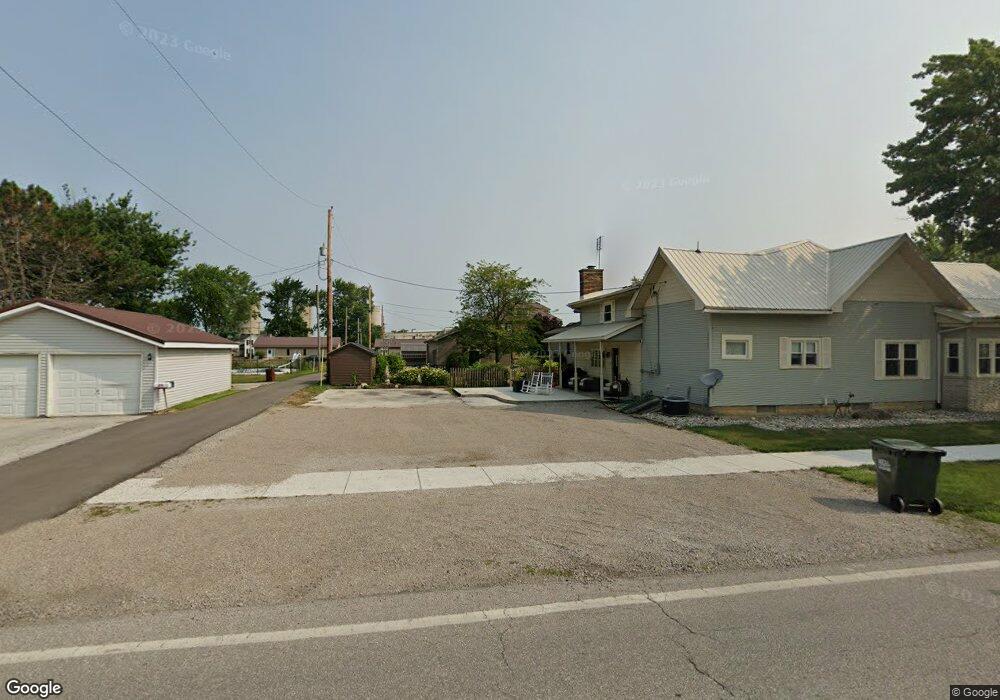
This home is located at 1459 Sr, Payne, OH 45880 and is currently estimated at $343,073, approximately $163 per square foot. 1459 Sr is a home located in Paulding County with nearby schools including Wayne Trace High School.
Ownership History
Date
Name
Owned For
Owner Type
Purchase Details
Closed on
Sep 27, 2019
Sold by
Wargolet Gregory L and Wargolet Diane M
Bought by
Ronquille Royce W
Current Estimated Value
Home Financials for this Owner
Home Financials are based on the most recent Mortgage that was taken out on this home.
Original Mortgage
$269,920
Outstanding Balance
$234,348
Interest Rate
3.6%
Mortgage Type
FHA
Estimated Equity
$108,725
Purchase Details
Closed on
Sep 19, 2013
Sold by
Crosby Craig A and Crosby Stacey D
Bought by
Wargolet Gregory L and Wargolet Diane M
Home Financials for this Owner
Home Financials are based on the most recent Mortgage that was taken out on this home.
Original Mortgage
$150,000
Interest Rate
4.56%
Mortgage Type
New Conventional
Purchase Details
Closed on
May 2, 2002
Bought by
Wargolet Gregory L Wargolet Diane M
Create a Home Valuation Report for This Property
The Home Valuation Report is an in-depth analysis detailing your home's value as well as a comparison with similar homes in the area
Purchase History
| Date | Buyer | Sale Price | Title Company |
|---|---|---|---|
| Ronquille Royce W | $274,900 | None Available | |
| Wargolet Gregory L | $215,000 | None Available | |
| Wargolet Gregory L Wargolet Diane M | -- | -- |
Source: Public Records
Mortgage History
| Date | Status | Borrower | Loan Amount |
|---|---|---|---|
| Open | Ronquille Royce W | $269,920 | |
| Previous Owner | Wargolet Gregory L | $150,000 |
Source: Public Records
Tax History
| Year | Tax Paid | Tax Assessment Tax Assessment Total Assessment is a certain percentage of the fair market value that is determined by local assessors to be the total taxable value of land and additions on the property. | Land | Improvement |
|---|---|---|---|---|
| 2025 | $4,183 | $135,070 | $14,420 | $120,650 |
| 2024 | $4,183 | $96,430 | $10,850 | $85,580 |
| 2023 | $3,292 | $96,430 | $10,850 | $85,580 |
| 2022 | $3,198 | $96,430 | $10,850 | $85,580 |
| 2021 | $2,780 | $75,500 | $9,980 | $65,520 |
| 2020 | $2,873 | $75,500 | $9,980 | $65,520 |
| 2019 | $2,887 | $66,960 | $9,980 | $56,980 |
| 2018 | $2,334 | $66,960 | $9,980 | $56,980 |
| 2017 | $2,337 | $66,960 | $9,980 | $56,980 |
| 2016 | $2,336 | $66,960 | $9,980 | $56,980 |
| 2015 | $2,221 | $65,420 | $8,160 | $57,260 |
| 2014 | $2,245 | $65,320 | $8,160 | $57,160 |
| 2013 | $2,543 | $62,660 | $8,160 | $54,500 |
Source: Public Records
Map
Nearby Homes
- 3497 Road 49
- 14720 State Line Rd
- 21000 Monroeville Rd
- 820 Brian Dr
- 404 E Forest St
- 220 Allen St
- 118 W Forest St
- 412 S Laura St
- 215 S Main St
- 19900 Dawkins Rd
- 6306 Road 55
- 6576 Elm Sugar Rd
- 17711 Howe Rd
- 22238 Travertine Run
- 3919 Beryl Place
- 22432 Peridot Run
- 4220 Oak St
- 158 Dealey Dr
- 152 Dealey Dr
- 116 Dealey Dr
- 1459 State Route 114
- 1459 Ohio 114
- 1472 State Route 114
- 1607 State Route 114
- 1704 State Route 114
- 1729 State Route 114
- 1065 State Route 114
- 1035 State Route 114
- 7734 State Line Rd
- 7904 State Line Rd
- 2004 State Route 114
- 7930 State Line Rd
- 2028 State Route 114
- 2232 State Route 114
- 25917 Castleman Rd
- 6710 State Line Rd
- 25628 Castleman Rd
- 0 State Line Rd
- 2364 State Route 114
- 1678 Road 48
Your Personal Tour Guide
Ask me questions while you tour the home.