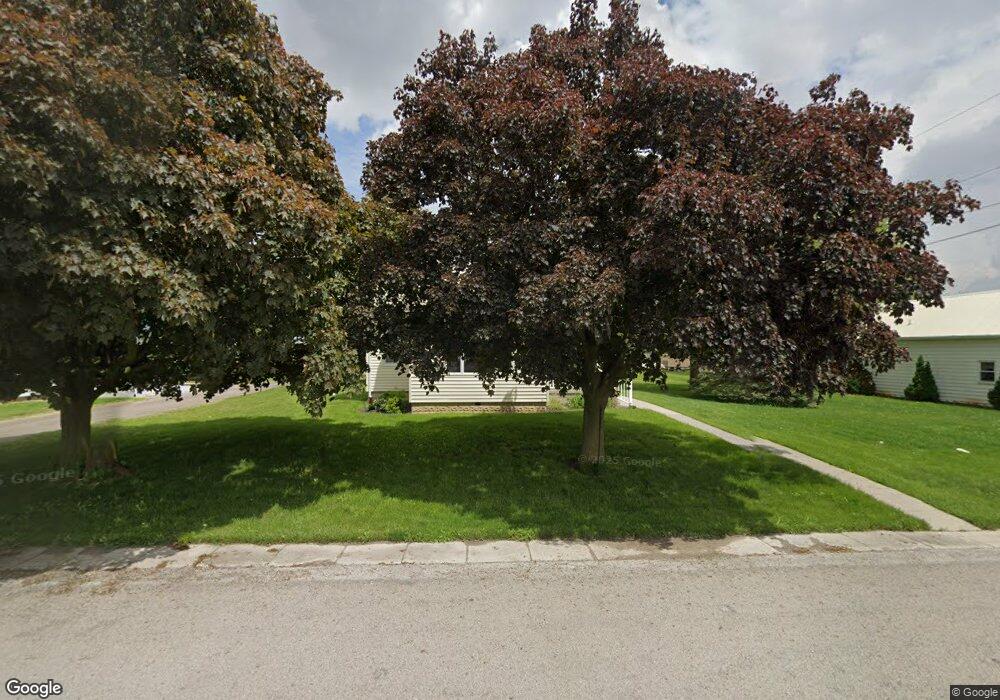
14594 Landeck Rd Delphos, OH 45833
Estimated Value: $115,000 - $174,912
4
Beds
2
Baths
1,956
Sq Ft
$77/Sq Ft
Est. Value
About This Home
This home is located at 14594 Landeck Rd, Delphos, OH 45833 and is currently estimated at $150,228, approximately $76 per square foot. 14594 Landeck Rd is a home located in Allen County.
Ownership History
Date
Name
Owned For
Owner Type
Purchase Details
Closed on
Apr 11, 2022
Bought by
Anthony W Gilroy
Current Estimated Value
Home Financials for this Owner
Home Financials are based on the most recent Mortgage that was taken out on this home.
Interest Rate
4.72%
Purchase Details
Closed on
Apr 8, 2022
Sold by
Miller Joseph E
Bought by
Gilroy Anthony W and Gilroy Elisabeth P
Home Financials for this Owner
Home Financials are based on the most recent Mortgage that was taken out on this home.
Interest Rate
4.72%
Purchase Details
Closed on
Feb 22, 2016
Bought by
Joseph E Miller
Home Financials for this Owner
Home Financials are based on the most recent Mortgage that was taken out on this home.
Interest Rate
3.65%
Purchase Details
Closed on
Jan 1, 1990
Bought by
Miller Joseph L
Create a Home Valuation Report for This Property
The Home Valuation Report is an in-depth analysis detailing your home's value as well as a comparison with similar homes in the area
Home Values in the Area
Average Home Value in this Area
Purchase History
| Date | Buyer | Sale Price | Title Company |
|---|---|---|---|
| Anthony W Gilroy | $98,750 | -- | |
| Gilroy Anthony W | $98,800 | Brock T Blain | |
| Joseph E Miller | $70,000 | -- | |
| Miller Joseph L | -- | -- |
Source: Public Records
Mortgage History
| Date | Status | Borrower | Loan Amount |
|---|---|---|---|
| Closed | Joseph E Miller | -- | |
| Open | Gilroy Anthony W | $79,000 | |
| Previous Owner | Joseph E Miller | -- |
Source: Public Records
Tax History Compared to Growth
Tax History
| Year | Tax Paid | Tax Assessment Tax Assessment Total Assessment is a certain percentage of the fair market value that is determined by local assessors to be the total taxable value of land and additions on the property. | Land | Improvement |
|---|---|---|---|---|
| 2024 | $1,784 | $58,000 | $13,020 | $44,980 |
| 2023 | $1,488 | $44,940 | $10,080 | $34,860 |
| 2022 | $1,558 | $44,940 | $10,080 | $34,860 |
| 2021 | $1,426 | $39,900 | $5,040 | $34,860 |
| 2020 | $1,085 | $33,670 | $4,760 | $28,910 |
| 2019 | $1,085 | $33,670 | $4,760 | $28,910 |
| 2018 | $1,059 | $33,670 | $4,760 | $28,910 |
| 2017 | $1,017 | $31,050 | $4,760 | $26,290 |
| 2016 | $1,041 | $31,050 | $4,760 | $26,290 |
| 2015 | $600 | $31,050 | $4,760 | $26,290 |
| 2014 | $600 | $27,060 | $4,380 | $22,680 |
| 2013 | $613 | $27,060 | $4,380 | $22,680 |
Source: Public Records
Map
Nearby Homes
- 11630 Clearview Dr
- 634 S Clay St
- 606 S Cass St
- 827 S Washington St
- 1001 S Adams St
- 21302 Masters Rd
- 516 S Main St
- 424 S Canal St
- 508 S Washington St
- 221 S Main St
- 409 N Bredeick St
- 616 W 5th St
- 503 W 6th St
- 604 W 6th St
- 19083 Venedocia Eastern Rd
- 19059 Wittington St
- 210 E 3rd St
- 15044 Main St
- 405 N Franklin St
- 18906 Bebb St