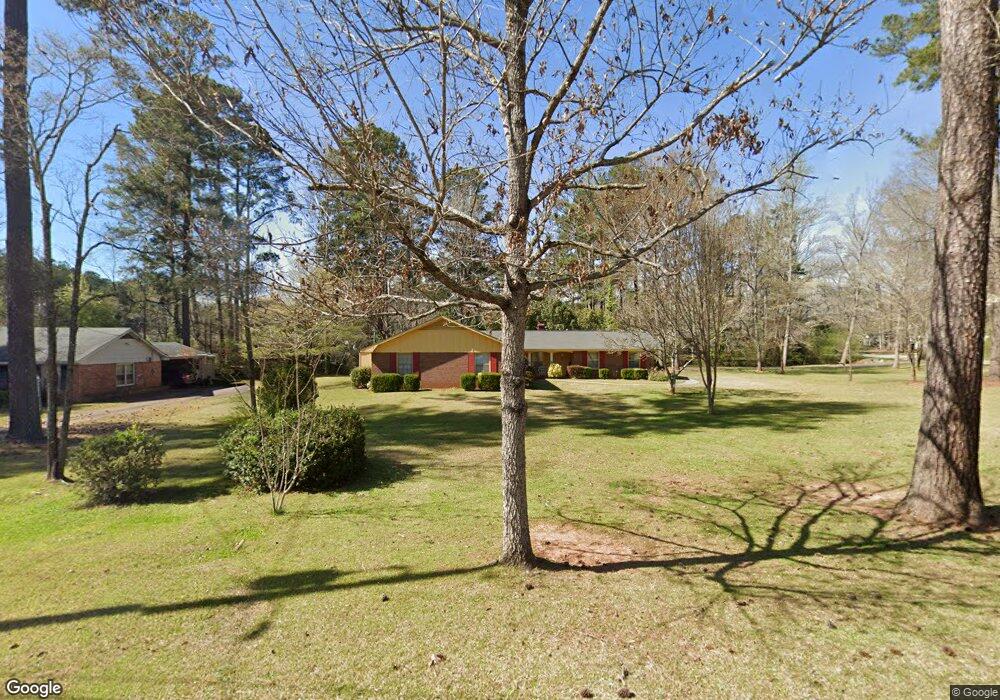
146 Cascade Cir Lagrange, GA 30241
Estimated Value: $229,000 - $241,000
3
Beds
3
Baths
1,749
Sq Ft
$135/Sq Ft
Est. Value
About This Home
This home is located at 146 Cascade Cir, Lagrange, GA 30241 and is currently estimated at $236,533, approximately $135 per square foot. 146 Cascade Cir is a home located in Troup County with nearby schools including Franklin Forest Elementary School, Hollis Hand Elementary School, and Ethel W. Kight Elementary School.
Ownership History
Date
Name
Owned For
Owner Type
Purchase Details
Closed on
May 27, 1997
Sold by
Radney L Houze
Bought by
Morris Jimmy F and Brenda Kay
Current Estimated Value
Purchase Details
Closed on
Feb 1, 1985
Sold by
Linz Werner A
Bought by
Radney L Houze
Purchase Details
Closed on
Jun 14, 1980
Sold by
Seay Stanley S and Seay Katharine B
Bought by
Linz Werner A
Purchase Details
Closed on
Oct 20, 1975
Sold by
Bailey Ellis and Bailey Ruth
Bought by
Seay Stanley S and Seay Katharine B
Purchase Details
Closed on
Jan 1, 1973
Sold by
Hearn Grace C
Bought by
Bailey Ellis and Bailey Ruth
Purchase Details
Closed on
Jan 1, 1972
Sold by
R Morgan B and R W
Bought by
Hearn Grace C
Purchase Details
Closed on
Jan 1, 1971
Sold by
Martin Roland
Bought by
R Morgan B and R W
Purchase Details
Closed on
Nov 1, 1968
Sold by
King Horace D
Bought by
Martin Roland
Create a Home Valuation Report for This Property
The Home Valuation Report is an in-depth analysis detailing your home's value as well as a comparison with similar homes in the area
Purchase History
| Date | Buyer | Sale Price | Title Company |
|---|---|---|---|
| Morris Jimmy F | $90,000 | -- | |
| Radney L Houze | $66,000 | -- | |
| Linz Werner A | $58,000 | -- | |
| Seay Stanley S | $41,000 | -- | |
| Bailey Ellis | $11,400 | -- | |
| Hearn Grace C | $9,400 | -- | |
| R Morgan B | $32,000 | -- | |
| Martin Roland | -- | -- |
Source: Public Records
Tax History
| Year | Tax Paid | Tax Assessment Tax Assessment Total Assessment is a certain percentage of the fair market value that is determined by local assessors to be the total taxable value of land and additions on the property. | Land | Improvement |
|---|---|---|---|---|
| 2025 | -- | $81,164 | $10,000 | $71,164 |
| 2024 | -- | $73,964 | $10,000 | $63,964 |
| 2023 | $0 | $67,324 | $10,000 | $57,324 |
| 2022 | $1,786 | $64,004 | $10,000 | $54,004 |
| 2021 | $1,517 | $50,284 | $8,000 | $42,284 |
| 2020 | $1,517 | $50,284 | $8,000 | $42,284 |
| 2019 | $1,473 | $48,833 | $9,969 | $38,864 |
| 2018 | $0 | $44,297 | $9,969 | $34,328 |
| 2017 | $0 | $44,297 | $9,969 | $34,328 |
| 2016 | $1,067 | $43,120 | $9,969 | $33,151 |
| 2015 | $998 | $40,836 | $10,596 | $30,240 |
| 2014 | $950 | $39,244 | $10,596 | $28,648 |
| 2013 | -- | $40,878 | $10,596 | $30,282 |
Source: Public Records
Map
Nearby Homes
- 114 Briarcliff Rd
- 806 New Franklin Rd
- 134 S Page St
- 204 Colonial St
- 202 Park Hill Dr
- 110 Russell St
- 102 Dogwood Dr
- 900 North St
- 203 Bonaventure Dr
- 210 Hearthstone Dr
- 224 Rutland Cir
- 109 Thomas St
- 706 N Harlem Cir
- 219 Banks St
- 129 Celebration Blvd
- 106 Ewing St
- 616 S Harlem Cir
- 517 Tradition Place
- 519 Tradition Place
- 793 Celebration Blvd
- 148 Cascade Cir
- 122 Preston Place
- 118 Preston Place
- 147 Alton Dr
- 143 Alton Dr
- 154 Alton Dr
- 126 Preston Place
- 150 Cascade Cir
- 151 Alton Dr
- 156 Alton Dr
- 153 Cascade Cir
- 139 Alton Dr
- 114 Preston Place
- 133 Preston Place
- 133 Preston Place Unit 11
- 157 Alton Dr
- 135 Preston Place
- 135 Preston Place Unit 12
- 131 Preston Place
- 137 Alton Dr
Your Personal Tour Guide
Ask me questions while you tour the home.