Estimated Value: $271,293 - $295,000
3
Beds
2
Baths
1,950
Sq Ft
$143/Sq Ft
Est. Value
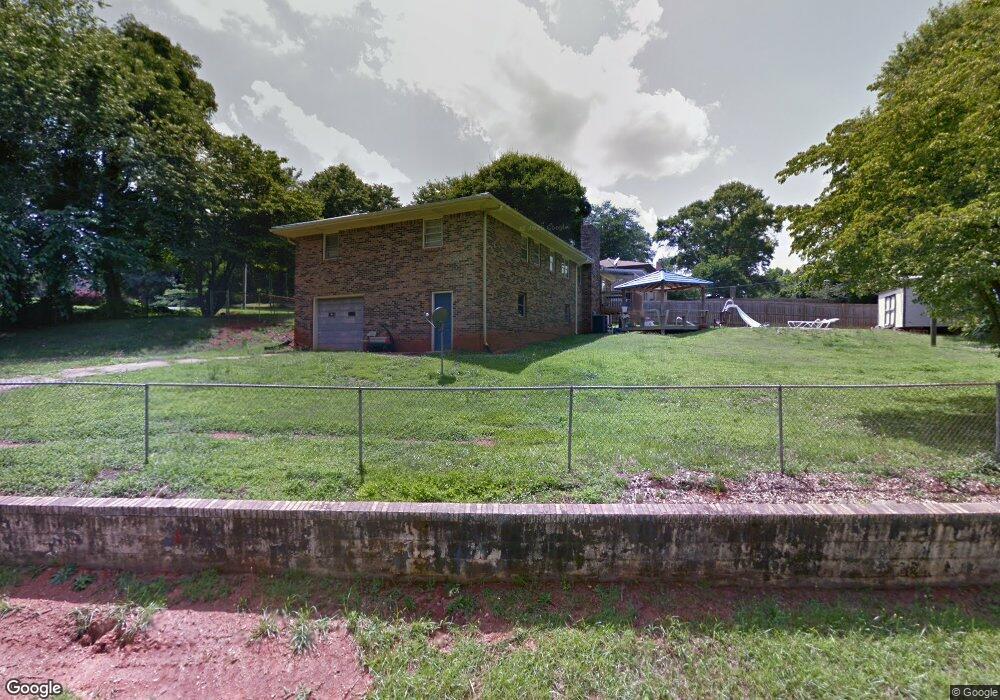
About This Home
This home is located at 146 Clearview Dr, Lyman, SC 29365 and is currently estimated at $278,823, approximately $142 per square foot. 146 Clearview Dr is a home located in Spartanburg County with nearby schools including Wellford Academy Of Science And Techology, Byrnes Freshman Academy, and D.R. Hill Middle School.
Ownership History
Date
Name
Owned For
Owner Type
Purchase Details
Closed on
May 2, 2023
Sold by
Whitesides Dennis M
Bought by
Curcio Christy Leah
Current Estimated Value
Home Financials for this Owner
Home Financials are based on the most recent Mortgage that was taken out on this home.
Original Mortgage
$235,653
Outstanding Balance
$228,711
Interest Rate
6.28%
Mortgage Type
FHA
Estimated Equity
$50,112
Purchase Details
Closed on
Jan 12, 2015
Sold by
Whitesides Benjamin H
Bought by
Whitesides Dennis M
Purchase Details
Closed on
Jun 11, 2013
Sold by
Whitesides Hugh P and Whitesides Hugh
Bought by
Whitesides Hugh P and The Hugh P Whitesides Revocable Trust
Purchase Details
Closed on
Feb 17, 2009
Sold by
Hawkins Phyllis W and Cox Phyllis
Bought by
Whitesides Hugh P
Create a Home Valuation Report for This Property
The Home Valuation Report is an in-depth analysis detailing your home's value as well as a comparison with similar homes in the area
Home Values in the Area
Average Home Value in this Area
Purchase History
| Date | Buyer | Sale Price | Title Company |
|---|---|---|---|
| Curcio Christy Leah | $240,000 | None Listed On Document | |
| Whitesides Dennis M | -- | -- | |
| Whitesides Hugh P | -- | -- | |
| Whitesides Hugh P | $70,150 | -- |
Source: Public Records
Mortgage History
| Date | Status | Borrower | Loan Amount |
|---|---|---|---|
| Open | Curcio Christy Leah | $235,653 |
Source: Public Records
Tax History
| Year | Tax Paid | Tax Assessment Tax Assessment Total Assessment is a certain percentage of the fair market value that is determined by local assessors to be the total taxable value of land and additions on the property. | Land | Improvement |
|---|---|---|---|---|
| 2022 | $1,163 | $5,285 | $625 | $4,660 |
| 2021 | $1,163 | $5,285 | $625 | $4,660 |
| 2020 | $1,145 | $5,285 | $625 | $4,660 |
| 2019 | $1,143 | $3,662 | $615 | $3,047 |
| 2018 | $782 | $3,662 | $615 | $3,047 |
| 2017 | $688 | $3,184 | $640 | $2,544 |
| 2016 | $672 | $3,184 | $640 | $2,544 |
| 2015 | $661 | $3,184 | $640 | $2,544 |
| 2014 | $2,010 | $4,776 | $960 | $3,816 |
Source: Public Records
Map
Nearby Homes
- 179 Beverly Ln
- 317 Tracy Ct
- 313 Tracy Ct
- 2101 Evanston Dr
- 129 James Ave
- 355 Laura Faye Ln
- 393 E Pyrenees Dr
- 265 State Road S-42-742
- 0 Suber Dr Unit 22675623
- 271 State Road S-42-742
- 273 State Road S-42-742
- 343 E Pyrenees Dr
- 947 Gibbons St
- 347 E Pyrenees Dr
- 194-C Half Moon Rd
- 194-A Half Moon Rd
- 194-B Half Moon Rd
- 194-D Half Moon Rd
- 194-E Half Moon Rd
- 339 E Pyrenees Dr
- 0 Beverly Ln Unit 1163209
- 0 Beverly Ln Unit 1170852
- 156 Clearview Dr
- 140 Clearview Dr
- 175 Beverly Ln
- 155 Clearview Dr
- 130 Beverly Ln
- 166 Clearview Dr
- 120 Clearview Dr
- 165 Clearview Dr
- 121 Clearview Dr
- 159 Beverly Ln
- 198 Beverly Ln
- 176 Clearview Dr
- 120 Beverly Ln
- 175 Clearview Dr
- 117 Clearview Dr
- 110 Clearview Dr
- 131 Beverly Ln
- 191 Beverly Ln
Your Personal Tour Guide
Ask me questions while you tour the home.