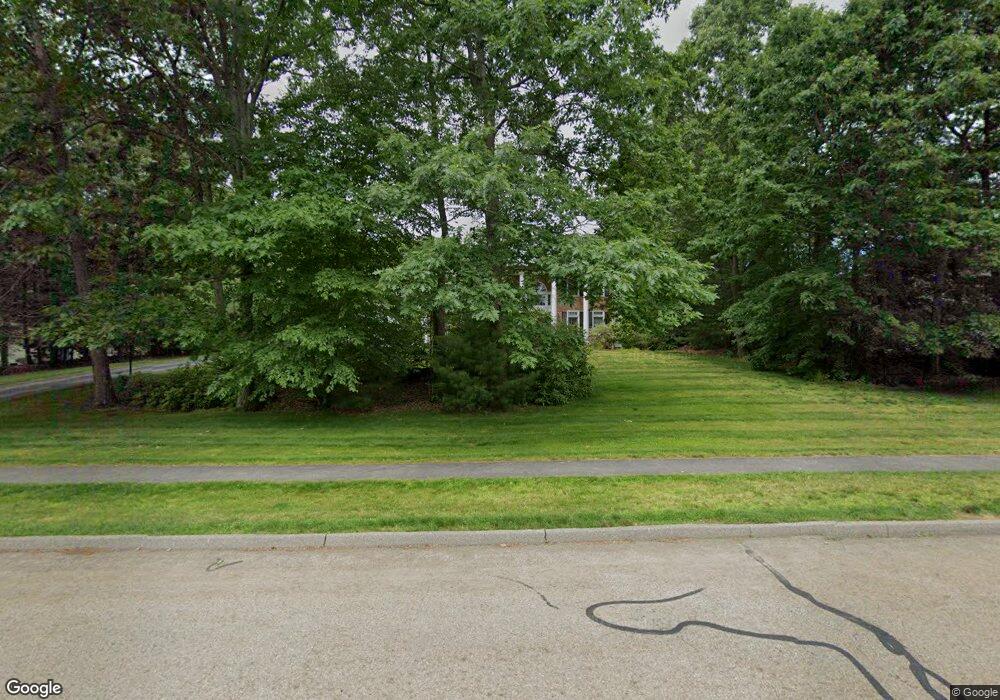
146 Cranbrook Dr Holden, MA 01520
Estimated Value: $890,980 - $1,100,000
4
Beds
3
Baths
2,990
Sq Ft
$321/Sq Ft
Est. Value
About This Home
This home is located at 146 Cranbrook Dr, Holden, MA 01520 and is currently estimated at $959,245, approximately $320 per square foot. 146 Cranbrook Dr is a home located in Worcester County with nearby schools including Wachusett Regional High School, Bancroft School, and Notre Dame Academy.
Ownership History
Date
Name
Owned For
Owner Type
Purchase Details
Closed on
Aug 20, 2014
Sold by
Stone Tarsha J
Bought by
Stone Tarsha J and Stone Charles G
Current Estimated Value
Purchase Details
Closed on
Nov 1, 1999
Sold by
Ba Sundin & Son Inc
Bought by
Anderson Albert S and Anderson Teresa H
Home Financials for this Owner
Home Financials are based on the most recent Mortgage that was taken out on this home.
Original Mortgage
$100,000
Interest Rate
7.73%
Create a Home Valuation Report for This Property
The Home Valuation Report is an in-depth analysis detailing your home's value as well as a comparison with similar homes in the area
Home Values in the Area
Average Home Value in this Area
Purchase History
| Date | Buyer | Sale Price | Title Company |
|---|---|---|---|
| Stone Tarsha J | -- | -- | |
| Stone Tarsha | -- | -- | |
| Anderson Albert S | $456,000 | -- |
Source: Public Records
Mortgage History
| Date | Status | Borrower | Loan Amount |
|---|---|---|---|
| Previous Owner | Anderson Albert S | $86,300 | |
| Previous Owner | Anderson Albert S | $100,000 | |
| Previous Owner | Anderson Albert S | $100,000 |
Source: Public Records
Tax History
| Year | Tax Paid | Tax Assessment Tax Assessment Total Assessment is a certain percentage of the fair market value that is determined by local assessors to be the total taxable value of land and additions on the property. | Land | Improvement |
|---|---|---|---|---|
| 2025 | $12,029 | $867,900 | $275,100 | $592,800 |
| 2024 | $11,561 | $817,000 | $243,200 | $573,800 |
| 2023 | $10,971 | $731,900 | $211,300 | $520,600 |
| 2022 | $10,701 | $646,200 | $172,100 | $474,100 |
| 2021 | $4,103 | $613,800 | $169,500 | $444,300 |
| 2020 | $10,382 | $610,700 | $162,100 | $448,600 |
| 2019 | $10,467 | $599,800 | $162,100 | $437,700 |
| 2018 | $10,887 | $618,200 | $154,600 | $463,600 |
| 2017 | $2,512 | $597,500 | $159,400 | $438,100 |
| 2016 | $9,822 | $569,400 | $152,300 | $417,100 |
| 2015 | $9,944 | $548,800 | $152,300 | $396,500 |
| 2014 | $9,997 | $563,200 | $152,300 | $410,900 |
Source: Public Records
Map
Nearby Homes
- 47 Harvest Cir
- 527 Salisbury St
- 23 Gail Dr
- 168 Twinbrooke Dr
- 131 Twinbrooke Dr
- 288 Fisher Rd
- 158 Chester St
- 4004 Brompton Cir
- 42 N Worcester Ave
- 0 Chapin Rd
- 90 Bjorklund Ave
- 289 Bailey Rd
- 770 Salisbury St Unit 333
- 250 Shrewsbury St
- 12 Tattan Farm Rd
- 46 Barry Rd
- 61 Barry Rd
- 8 (Lot 1) Holmes Dr
- 120 Brattle St
- 270 Brattle St
- 158 Cranbrook Dr
- 134 Cranbrook Dr
- 153 Cranbrook Dr
- 139 Cranbrook Dr
- 170 Cranbrook Dr
- 165 Cranbrook Dr
- 125 Cranbrook Dr
- 116 Cranbrook Dr
- 116 Cranbrook Dr
- 177 Cranbrook Dr
- 184 Cranbrook Dr
- 113 Cranbrook Dr
- 96 Cranbrook Dr
- 70 Cranbrook Dr
- 189 Cranbrook Dr
- 101 Cranbrook Dr
- 196 Cranbrook Dr
- 201 Cranbrook Dr
- 93 Cranbrook Dr
- 24 Mark Cir
Your Personal Tour Guide
Ask me questions while you tour the home.