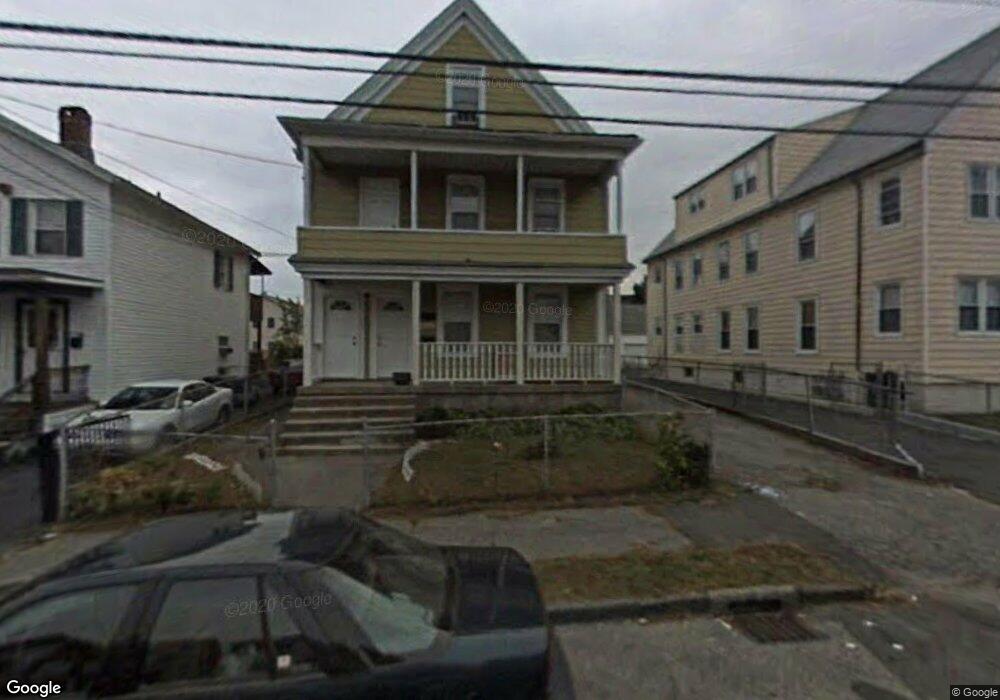
146 Deacon St Unit 148 Bridgeport, CT 06607
East End NeighborhoodEstimated Value: $192,497 - $446,000
6
Beds
3
Baths
2,916
Sq Ft
$127/Sq Ft
Est. Value
About This Home
This home is located at 146 Deacon St Unit 148, Bridgeport, CT 06607 and is currently estimated at $369,124, approximately $126 per square foot. 146 Deacon St Unit 148 is a home located in Fairfield County with nearby schools including Dunbar School, Harding High School, and Capital Prep Harbor Upper School.
Ownership History
Date
Name
Owned For
Owner Type
Purchase Details
Closed on
Mar 27, 2014
Sold by
Pinos Alba
Bought by
Borjas Marlin
Current Estimated Value
Home Financials for this Owner
Home Financials are based on the most recent Mortgage that was taken out on this home.
Original Mortgage
$99,170
Outstanding Balance
$75,188
Interest Rate
4.27%
Mortgage Type
New Conventional
Estimated Equity
$293,936
Purchase Details
Closed on
Jan 2, 2002
Sold by
Torres Oswaldo
Bought by
Cobos Manuel A
Home Financials for this Owner
Home Financials are based on the most recent Mortgage that was taken out on this home.
Original Mortgage
$185,000
Interest Rate
6.72%
Purchase Details
Closed on
Jul 5, 2001
Sold by
Watkins Paula
Bought by
Torres Oswaldo
Create a Home Valuation Report for This Property
The Home Valuation Report is an in-depth analysis detailing your home's value as well as a comparison with similar homes in the area
Home Values in the Area
Average Home Value in this Area
Purchase History
| Date | Buyer | Sale Price | Title Company |
|---|---|---|---|
| Borjas Marlin | $101,000 | -- | |
| Borjas Marlin | $101,000 | -- | |
| Cobos Manuel A | $189,900 | -- | |
| Cobos Manuel A | $189,900 | -- | |
| Torres Oswaldo | $40,000 | -- | |
| Torres Oswaldo | $40,000 | -- |
Source: Public Records
Mortgage History
| Date | Status | Borrower | Loan Amount |
|---|---|---|---|
| Open | Torres Oswaldo | $99,170 | |
| Closed | Torres Oswaldo | $99,170 | |
| Previous Owner | Torres Oswaldo | $185,000 |
Source: Public Records
Tax History Compared to Growth
Tax History
| Year | Tax Paid | Tax Assessment Tax Assessment Total Assessment is a certain percentage of the fair market value that is determined by local assessors to be the total taxable value of land and additions on the property. | Land | Improvement |
|---|---|---|---|---|
| 2025 | $6,687 | $153,910 | $34,130 | $119,780 |
| 2024 | $6,687 | $153,910 | $34,130 | $119,780 |
| 2023 | $6,687 | $153,910 | $34,130 | $119,780 |
| 2022 | $6,687 | $153,910 | $34,130 | $119,780 |
| 2021 | $6,687 | $153,910 | $34,130 | $119,780 |
| 2020 | $6,398 | $118,500 | $19,090 | $99,410 |
| 2019 | $6,398 | $118,500 | $19,090 | $99,410 |
| 2018 | $6,443 | $118,500 | $19,090 | $99,410 |
| 2017 | $6,443 | $118,500 | $19,090 | $99,410 |
| 2016 | $6,443 | $118,500 | $19,090 | $99,410 |
| 2015 | $6,955 | $164,800 | $32,730 | $132,070 |
| 2014 | $6,955 | $164,800 | $32,730 | $132,070 |
Source: Public Records
Map
Nearby Homes
- 180 Holly St
- 228 Holly St Unit 230
- 247 6th St
- 221 Bunnell St
- 819 Connecticut Ave Unit 6
- 566 Wilmot Ave Unit 4
- 49 Bunnell St Unit 51
- 54 6th St
- 610 Wilmot Ave Unit 4
- 591 Wilmot Ave Unit 3
- 40 5th St
- 580 Wilmot Ave Unit 2
- 785 Connecticut Ave Unit 2
- 643 Newfield Ave Unit 645
- 93 Clifford St
- 60 Gilmore St
- 445 Nichols St
- 1440 Stratford Ave
- 249 Hough Ave Unit 251
- 408 Union Ave
- 146 Deacon St Unit 2FLR
- 152 Deacon St
- 132 Deacon St Unit 134
- 166 Deacon St Unit 168
- 166 Deacon St Unit 2ND
- 153 Deacon St Unit 155
- 137 Deacon St
- 137 Deacon St Unit 139
- 128 Deacon St
- 145 Deacon St Unit 147
- 129 Deacon St Unit 131
- 121 Deacon St
- 163 Deacon St Unit 163 DEACON STREET 3RD FLR
- 161 Deacon St Unit 163
- 161 Deacon St Unit 2nd fl
- 161-163 Deacon St
- 161-163 Deacon St Unit 163
- 161 Deacon St
- 110 Deacon St
- 175 Deacon St