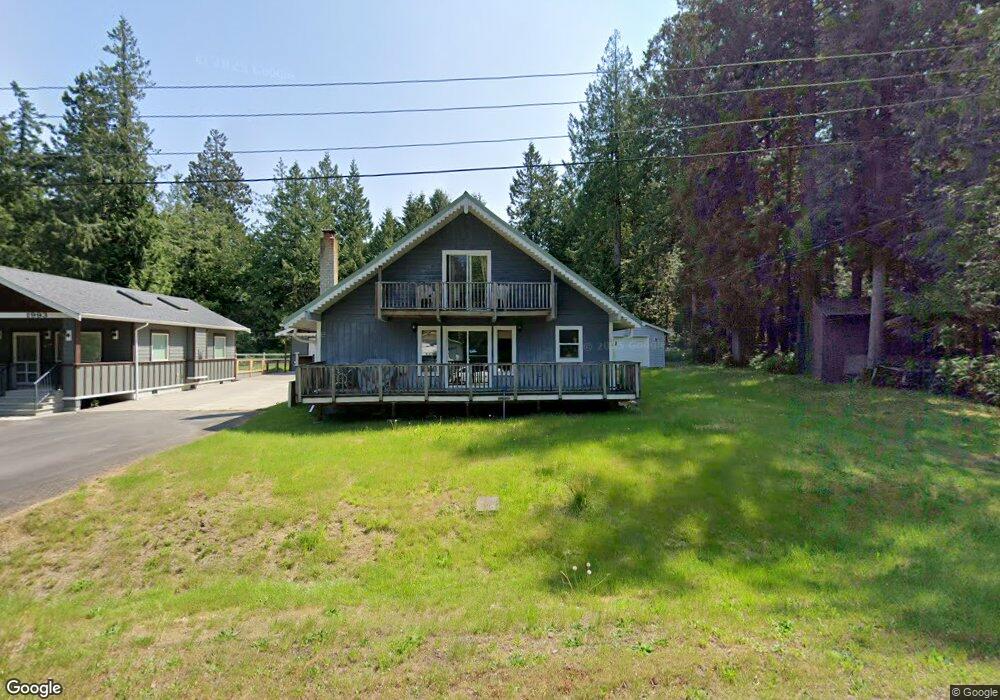
146 Drake Ave Point Roberts, WA 98281
Estimated Value: $363,273 - $432,000
2
Beds
1
Bath
1,275
Sq Ft
$319/Sq Ft
Est. Value
About This Home
This home is located at 146 Drake Ave, Point Roberts, WA 98281 and is currently estimated at $406,818, approximately $319 per square foot. 146 Drake Ave is a home located in Whatcom County with nearby schools including Point Roberts Primary School, Blaine Middle School, and Blaine High School.
Ownership History
Date
Name
Owned For
Owner Type
Purchase Details
Closed on
Nov 29, 2007
Sold by
Donaghy Marlene C
Bought by
Geary Wililam H and Geary Susanna S
Current Estimated Value
Purchase Details
Closed on
Jul 6, 2005
Sold by
Federal National Mortgage Association
Bought by
Donaghy Marlene C
Home Financials for this Owner
Home Financials are based on the most recent Mortgage that was taken out on this home.
Original Mortgage
$74,610
Interest Rate
5.56%
Mortgage Type
Fannie Mae Freddie Mac
Purchase Details
Closed on
May 9, 2005
Sold by
Martinez Lee Albert and Martinez Dorothy Kyla
Bought by
Federal National Mortgage Association
Home Financials for this Owner
Home Financials are based on the most recent Mortgage that was taken out on this home.
Original Mortgage
$74,610
Interest Rate
5.56%
Mortgage Type
Fannie Mae Freddie Mac
Purchase Details
Closed on
May 31, 2001
Sold by
Bray Edward K
Bought by
Martinez Lee Albert and Martinez Dorothy Kyla
Create a Home Valuation Report for This Property
The Home Valuation Report is an in-depth analysis detailing your home's value as well as a comparison with similar homes in the area
Home Values in the Area
Average Home Value in this Area
Purchase History
| Date | Buyer | Sale Price | Title Company |
|---|---|---|---|
| Geary Wililam H | $201,280 | Chicago Title Insurance | |
| Donaghy Marlene C | $82,900 | First American Title Insuran | |
| Federal National Mortgage Association | $72,784 | First American Title Insuran | |
| Martinez Lee Albert | -- | Chicago Title Insurance |
Source: Public Records
Mortgage History
| Date | Status | Borrower | Loan Amount |
|---|---|---|---|
| Previous Owner | Donaghy Marlene C | $74,610 |
Source: Public Records
Tax History
| Year | Tax Paid | Tax Assessment Tax Assessment Total Assessment is a certain percentage of the fair market value that is determined by local assessors to be the total taxable value of land and additions on the property. | Land | Improvement |
|---|---|---|---|---|
| 2025 | $2,521 | $299,145 | $103,403 | $195,742 |
| 2024 | $2,436 | $296,178 | $102,383 | $193,795 |
| 2023 | $2,436 | $286,870 | $93,075 | $193,795 |
| 2022 | $1,739 | $261,982 | $85,000 | $176,982 |
| 2021 | $1,733 | $165,395 | $32,102 | $133,293 |
| 2020 | $1,728 | $153,142 | $29,724 | $123,418 |
| 2019 | $1,609 | $146,897 | $28,512 | $118,385 |
| 2018 | $1,460 | $132,059 | $25,632 | $106,427 |
| 2017 | $1,267 | $126,124 | $24,480 | $101,644 |
| 2016 | $1,369 | $123,651 | $24,000 | $99,651 |
| 2015 | $1,456 | $130,067 | $32,847 | $97,220 |
| 2014 | -- | $135,975 | $34,340 | $101,635 |
| 2013 | -- | $129,968 | $32,980 | $96,988 |
Source: Public Records
Map
Nearby Homes
- 0 15 Whalen Dr
- 19 Whalen Dr
- 0 3 73 Acres Derby Ave
- 2123 Whalen Dr
- 36 Ontario Way
- 1857 Washington Dr
- 1953 Province Rd
- 103 Goodman Rd
- 16 Burns Way
- 2 Mill Rd
- 2138 Benson Rd
- 251 Elizabeth Dr
- 245 Shady Glen Ave
- 0 Deer Rd
- Lot 3 Deer Rd
- 1940 Cedar Park Dr
- 25 Roosevelt Way
- 6 Weasel Run Rd
- 157 Northwood Dr
- 167 Northwood Dr
- 1993 Drake Ave
- 1989 Drake Ave
- 1997 Wellington Rd
- 1999 Drake Ave
- 1995 Drake Ave
- 1994 Drake Ave
- 1981 Wellington Rd
- 1979 Wellington Rd
- 2039 Whalen Dr
- 1990 Wellington Rd
- 1977 Drake Ave
- 1966 Drake Ave
- 180 Nelson Rd
- 1976 Drake Ave
- 1981 Drake Ave
- 1986 Wellington Rd
- 1994 Wellington Rd
- 0 Lot 4 Drake Ave
- 34 Nelson Rd
- 1976 Wellington Rd
Your Personal Tour Guide
Ask me questions while you tour the home.