146 E 100 N Logan, UT 84321
Wilson NeighborhoodEstimated Value: $386,000
Studio
--
Bath
3,182
Sq Ft
$121/Sq Ft
Est. Value
About This Home
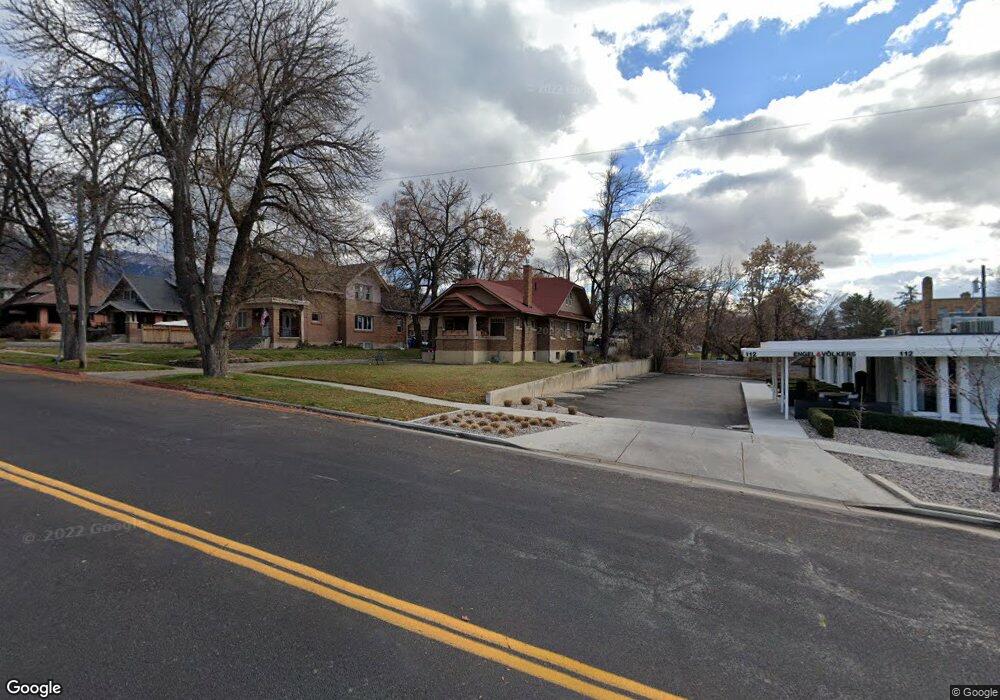
This home is located at 146 E 100 N, Logan, UT 84321 and is currently estimated at $386,000, approximately $121 per square foot. 146 E 100 N is a home located in Cache County with nearby schools including Wilson School, Mount Logan Middle School, and Logan High School.
Ownership History
Date
Name
Owned For
Owner Type
Purchase Details
Closed on
Jun 7, 2010
Sold by
Ong Investment Lc
Bought by
Living Stone Downtown Property Llc
Current Estimated Value
Purchase Details
Closed on
Feb 22, 2010
Sold by
Einerson Tammy and Einerson Scott
Bought by
Ong Investment Llc
Purchase Details
Closed on
Dec 18, 2009
Sold by
B G T S Properties Llc
Bought by
Einerson Tammy and Einerson Scott
Purchase Details
Closed on
Dec 5, 2006
Sold by
Baugh Jeffrey C and Baugh Joanne N
Bought by
Roberts Gary L and Roberts Benita Quakenbush
Home Financials for this Owner
Home Financials are based on the most recent Mortgage that was taken out on this home.
Original Mortgage
$168,000
Interest Rate
6.38%
Mortgage Type
Commercial
Create a Home Valuation Report for This Property
The Home Valuation Report is an in-depth analysis detailing your home's value as well as a comparison with similar homes in the area
Home Values in the Area
Average Home Value in this Area
Purchase History
| Date | Buyer | Sale Price | Title Company |
|---|---|---|---|
| Living Stone Downtown Property Llc | -- | None Available | |
| Ong Investment Llc | -- | Pinnacle Title Ins Agency | |
| Einerson Tammy | -- | None Available | |
| Roberts Gary L | -- | Advanced Title |
Source: Public Records
Mortgage History
| Date | Status | Borrower | Loan Amount |
|---|---|---|---|
| Previous Owner | Roberts Gary L | $168,000 |
Source: Public Records
Tax History
| Year | Tax Paid | Tax Assessment Tax Assessment Total Assessment is a certain percentage of the fair market value that is determined by local assessors to be the total taxable value of land and additions on the property. | Land | Improvement |
|---|---|---|---|---|
| 2025 | $2,442 | $315,874 | $103,735 | $212,139 |
| 2024 | $2,658 | $332,935 | $103,735 | $229,200 |
| 2023 | $2,747 | $327,995 | $98,795 | $229,200 |
| 2022 | $2,900 | $323,290 | $94,090 | $229,200 |
| 2021 | $2,618 | $248,008 | $78,408 | $169,600 |
| 2020 | $2,909 | $248,008 | $78,408 | $169,600 |
| 2019 | $3,040 | $248,008 | $78,408 | $169,600 |
| 2018 | $3,330 | $248,008 | $78,408 | $169,600 |
| 2017 | $3,464 | $248,010 | $0 | $0 |
| 2016 | $3,591 | $227,925 | $0 | $0 |
| 2015 | $3,304 | $227,925 | $0 | $0 |
| 2014 | $2,987 | $227,925 | $0 | $0 |
| 2013 | -- | $227,925 | $0 | $0 |
Source: Public Records
Map
Nearby Homes
Your Personal Tour Guide
Ask me questions while you tour the home.