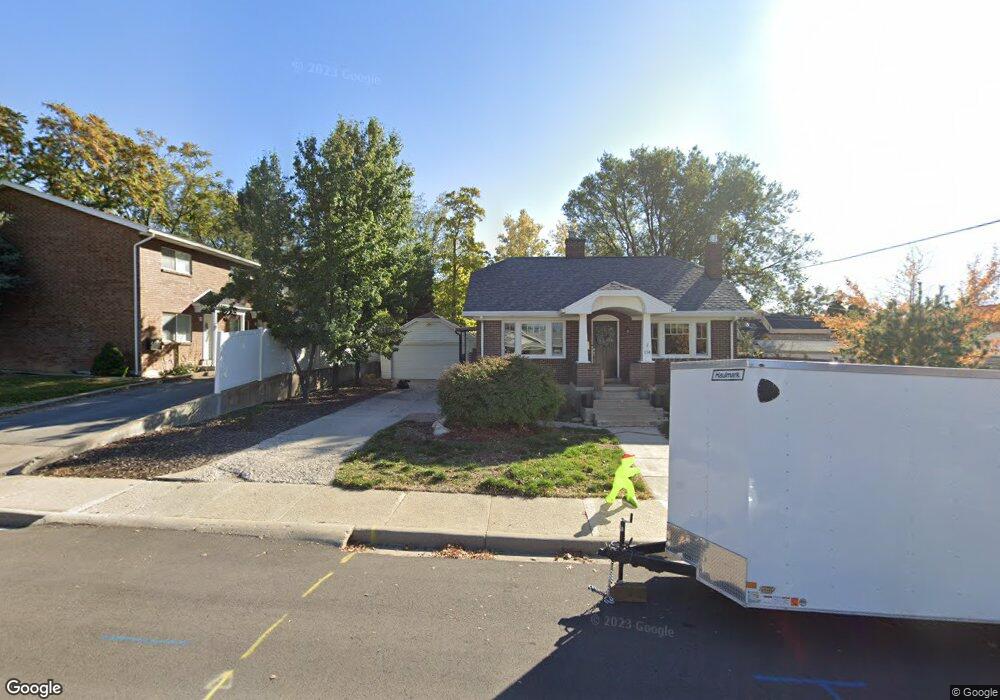
146 E 100 S Unit 1 Bountiful, UT 84010
Estimated Value: $376,000 - $383,540
3
Beds
3
Baths
1,734
Sq Ft
$219/Sq Ft
Est. Value
About This Home
This home is located at 146 E 100 S Unit 1, Bountiful, UT 84010 and is currently estimated at $379,135, approximately $218 per square foot. 146 E 100 S Unit 1 is a home located in Davis County with nearby schools including Holbrook Elementary School, Millcreek Junior High School, and Bountiful High School.
Ownership History
Date
Name
Owned For
Owner Type
Purchase Details
Closed on
Nov 18, 2021
Sold by
Brock Joseph and Brock Morgan
Bought by
Chamberlain Emily
Current Estimated Value
Home Financials for this Owner
Home Financials are based on the most recent Mortgage that was taken out on this home.
Original Mortgage
$246,000
Outstanding Balance
$225,728
Interest Rate
3.09%
Mortgage Type
New Conventional
Estimated Equity
$153,407
Purchase Details
Closed on
Jul 21, 2017
Sold by
Brock Joseph and Anderson Morgan
Bought by
Brock Joseph and Brock Morgan
Purchase Details
Closed on
Jun 29, 2016
Sold by
Christensen Christy M and Coons Christy M
Bought by
Brock Joseph and Anderson Morgan
Purchase Details
Closed on
Mar 30, 2010
Sold by
Kessler Michael A
Bought by
Coons Christy M
Home Financials for this Owner
Home Financials are based on the most recent Mortgage that was taken out on this home.
Original Mortgage
$129,280
Interest Rate
4.88%
Mortgage Type
New Conventional
Create a Home Valuation Report for This Property
The Home Valuation Report is an in-depth analysis detailing your home's value as well as a comparison with similar homes in the area
Purchase History
| Date | Buyer | Sale Price | Title Company |
|---|---|---|---|
| Chamberlain Emily | -- | Backman Title Servic | |
| Brock Joseph | -- | Backman Title | |
| Brock Joseph | -- | North American Title | |
| Coons Christy M | -- | Bonneville Superior Titl |
Source: Public Records
Mortgage History
| Date | Status | Borrower | Loan Amount |
|---|---|---|---|
| Open | Chamberlain Emily | $246,000 | |
| Previous Owner | Coons Christy M | $129,280 |
Source: Public Records
Tax History
| Year | Tax Paid | Tax Assessment Tax Assessment Total Assessment is a certain percentage of the fair market value that is determined by local assessors to be the total taxable value of land and additions on the property. | Land | Improvement |
|---|---|---|---|---|
| 2025 | $2,040 | $191,400 | $55,550 | $135,850 |
| 2024 | $2,053 | $198,000 | $40,150 | $157,850 |
| 2023 | $2,023 | $354,000 | $72,000 | $282,000 |
| 2022 | $2,102 | $201,850 | $39,050 | $162,800 |
| 2021 | $1,810 | $265,000 | $60,000 | $205,000 |
| 2020 | $1,597 | $235,000 | $55,600 | $179,400 |
| 2019 | $1,581 | $227,000 | $52,000 | $175,000 |
| 2018 | $1,437 | $203,000 | $54,000 | $149,000 |
| 2016 | $1,242 | $94,985 | $18,425 | $76,560 |
| 2015 | $1,155 | $83,215 | $18,425 | $64,790 |
| 2014 | $1,228 | $91,261 | $18,333 | $72,928 |
| 2013 | -- | $83,057 | $15,675 | $67,382 |
Source: Public Records
Map
Nearby Homes
- 357 S 100 E
- 255 E 400 S
- 32 W 400 S
- 55 E 200 N Unit 2
- 34 W 400 S
- 51 E 200 N Unit 3
- 49 E 200 N Unit 4
- 41 E 200 N Unit 6
- 254 N Main St
- 256 N Main St
- 252 N Main St
- 545 S 100 E
- 520 S Orchard Dr Unit 17
- 275 E Peach Ln S
- 650 S Main St Unit 6206
- 650 S Main St Unit 4104
- 650 S Main St Unit 9106
- 456 E 500 S
- 323 Peach Ln
- 453 N 400 E Unit 7-D
Your Personal Tour Guide
Ask me questions while you tour the home.