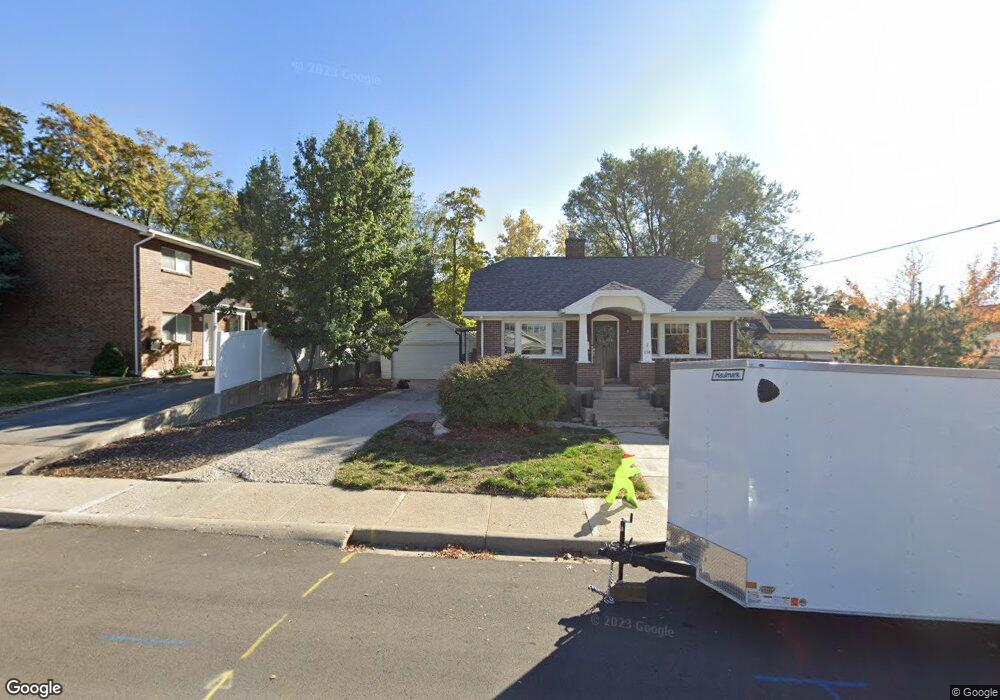
146 E 100 S Unit 3 Bountiful, UT 84010
Estimated Value: $352,000 - $407,000
3
Beds
3
Baths
1,632
Sq Ft
$230/Sq Ft
Est. Value
About This Home
This home is located at 146 E 100 S Unit 3, Bountiful, UT 84010 and is currently estimated at $375,580, approximately $230 per square foot. 146 E 100 S Unit 3 is a home located in Davis County with nearby schools including Holbrook Elementary School, Millcreek Junior High School, and Bountiful High School.
Ownership History
Date
Name
Owned For
Owner Type
Purchase Details
Closed on
Dec 28, 2021
Sold by
Gold Janet R and The Janet R Gold Family Trust
Bought by
Hernandez Kristen and Hernandez Caesar
Current Estimated Value
Home Financials for this Owner
Home Financials are based on the most recent Mortgage that was taken out on this home.
Original Mortgage
$333,687
Outstanding Balance
$306,904
Interest Rate
3.11%
Mortgage Type
New Conventional
Estimated Equity
$68,676
Purchase Details
Closed on
Feb 7, 2018
Sold by
Gold Jane R
Bought by
Gold Janet R and Gold Family Trust
Purchase Details
Closed on
Aug 6, 2013
Sold by
Jacobs Ian and Jacobs Sarah
Bought by
Gold Janet R
Purchase Details
Closed on
Oct 30, 2008
Sold by
Kessler Michael A
Bought by
Jacobs Ian and Jacobs Sarah
Home Financials for this Owner
Home Financials are based on the most recent Mortgage that was taken out on this home.
Original Mortgage
$148,000
Interest Rate
5.28%
Mortgage Type
Balloon
Create a Home Valuation Report for This Property
The Home Valuation Report is an in-depth analysis detailing your home's value as well as a comparison with similar homes in the area
Purchase History
| Date | Buyer | Sale Price | Title Company |
|---|---|---|---|
| Hernandez Kristen | -- | Aspen Title Insurance | |
| Gold Janet R | -- | -- | |
| Gold Janet R | -- | Us Title Company Of | |
| Jacobs Ian | -- | Bonneville Superior Title Co |
Source: Public Records
Mortgage History
| Date | Status | Borrower | Loan Amount |
|---|---|---|---|
| Open | Hernandez Kristen | $333,687 | |
| Previous Owner | Jacobs Ian | $148,000 |
Source: Public Records
Tax History
| Year | Tax Paid | Tax Assessment Tax Assessment Total Assessment is a certain percentage of the fair market value that is determined by local assessors to be the total taxable value of land and additions on the property. | Land | Improvement |
|---|---|---|---|---|
| 2025 | $1,996 | $187,000 | $55,550 | $131,450 |
| 2024 | $2,009 | $193,600 | $40,150 | $153,450 |
| 2023 | $1,973 | $345,000 | $72,000 | $273,000 |
| 2022 | $2,052 | $196,900 | $39,050 | $157,850 |
| 2021 | $1,771 | $259,000 | $60,000 | $199,000 |
| 2020 | $1,552 | $228,000 | $55,600 | $172,400 |
| 2019 | $1,541 | $221,000 | $52,000 | $169,000 |
| 2018 | $1,403 | $198,000 | $54,000 | $144,000 |
| 2016 | $1,158 | $88,220 | $18,425 | $69,795 |
| 2015 | $1,103 | $79,255 | $18,425 | $60,830 |
| 2014 | $1,193 | $88,550 | $18,333 | $70,217 |
| 2013 | -- | $82,513 | $15,675 | $66,838 |
Source: Public Records
Map
Nearby Homes
- 357 S 100 E
- 255 E 400 S
- 32 W 400 S
- 55 E 200 N Unit 2
- 34 W 400 S
- 51 E 200 N Unit 3
- 49 E 200 N Unit 4
- 41 E 200 N Unit 6
- 254 N Main St
- 256 N Main St
- 252 N Main St
- 545 S 100 E
- 275 E Peach Ln S
- 650 S Main St Unit 7107
- 650 S Main St Unit 6206
- 650 S Main St Unit 4104
- 650 S Main St Unit 9106
- 456 E 500 S
- 323 Peach Ln
- 17 E 400 N Unit 19B
Your Personal Tour Guide
Ask me questions while you tour the home.