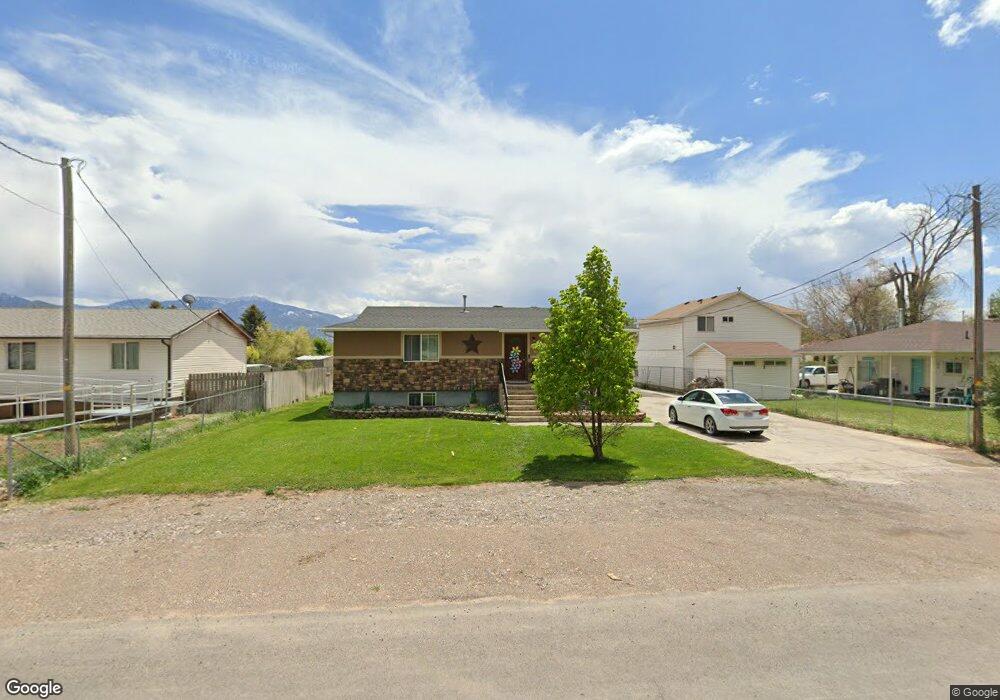
146 E 400 N Elsinore, UT 84724
Estimated Value: $232,000 - $332,000
5
Beds
1
Bath
2,112
Sq Ft
$134/Sq Ft
Est. Value
About This Home
This home is located at 146 E 400 N, Elsinore, UT 84724 and is currently estimated at $283,035, approximately $134 per square foot. 146 E 400 N is a home located in Sevier County with nearby schools including Monroe School, South Sevier Middle School, and South Sevier High School.
Ownership History
Date
Name
Owned For
Owner Type
Purchase Details
Closed on
Jun 15, 2020
Sold by
Oldroyd Mirenda
Bought by
Chappell Max E and Chappell Anna M
Current Estimated Value
Home Financials for this Owner
Home Financials are based on the most recent Mortgage that was taken out on this home.
Original Mortgage
$155,200
Outstanding Balance
$139,193
Interest Rate
3.2%
Mortgage Type
USDA
Estimated Equity
$143,842
Purchase Details
Closed on
Mar 30, 2017
Sold by
Oldroyd Evelyn and Oldroyd David
Bought by
Oldroyd Mirenda
Home Financials for this Owner
Home Financials are based on the most recent Mortgage that was taken out on this home.
Original Mortgage
$131,474
Interest Rate
4.2%
Mortgage Type
FHA
Purchase Details
Closed on
Apr 17, 2009
Sold by
Oldroyd Evelyn
Bought by
Oldroyd Evelyn and Oldroyd David
Home Financials for this Owner
Home Financials are based on the most recent Mortgage that was taken out on this home.
Original Mortgage
$112,433
Interest Rate
4.99%
Mortgage Type
FHA
Create a Home Valuation Report for This Property
The Home Valuation Report is an in-depth analysis detailing your home's value as well as a comparison with similar homes in the area
Purchase History
We collect this data history from publicly available records. To have your information removed, we recommend requesting removal directly through your county’s website.
| Date | Buyer | Sale Price | Title Company |
|---|---|---|---|
| Chappell Max E | -- | Lydolph & Weierholt Ttl Ins | |
| Oldroyd Mirenda | -- | Utah Title | |
| Oldroyd Evelyn | -- | First American Title Ins Co | |
| Oldroyd Evelyn | -- | First American Title Ins Age |
Source: Public Records
Mortgage History
We collect this data history from publicly available records. To have your information removed, we recommend requesting removal directly through your county’s website.
| Date | Status | Borrower | Loan Amount |
|---|---|---|---|
| Open | Chappell Max E | $155,200 | |
| Previous Owner | Oldroyd Mirenda | $131,474 | |
| Previous Owner | Oldroyd Evelyn | $112,433 |
Source: Public Records
Tax History
| Year | Tax Paid | Tax Assessment Tax Assessment Total Assessment is a certain percentage of the fair market value that is determined by local assessors to be the total taxable value of land and additions on the property. | Land | Improvement |
|---|---|---|---|---|
| 2025 | $1,049 | $121,505 | $30,029 | $91,476 |
| 2024 | $1,049 | $126,201 | $21,781 | $104,420 |
| 2023 | $1,112 | $126,509 | $18,442 | $108,067 |
| 2022 | $1,133 | $111,840 | $12,346 | $99,494 |
| 2021 | $1,056 | $86,160 | $12,672 | $73,488 |
| 2020 | $975 | $74,557 | $7,920 | $66,637 |
| 2019 | $861 | $70,100 | $7,920 | $62,180 |
| 2018 | $873 | $63,250 | $7,920 | $55,330 |
| 2017 | $863 | $59,830 | $7,920 | $51,910 |
| 2016 | $634 | $55,690 | $0 | $0 |
| 2015 | $634 | $55,690 | $0 | $0 |
| 2014 | $634 | $55,690 | $0 | $0 |
Source: Public Records
Map
Nearby Homes
Your Personal Tour Guide
Ask me questions while you tour the home.