Estimated Value: $267,000 - $283,000
4
Beds
2
Baths
1,828
Sq Ft
$150/Sq Ft
Est. Value
About This Home
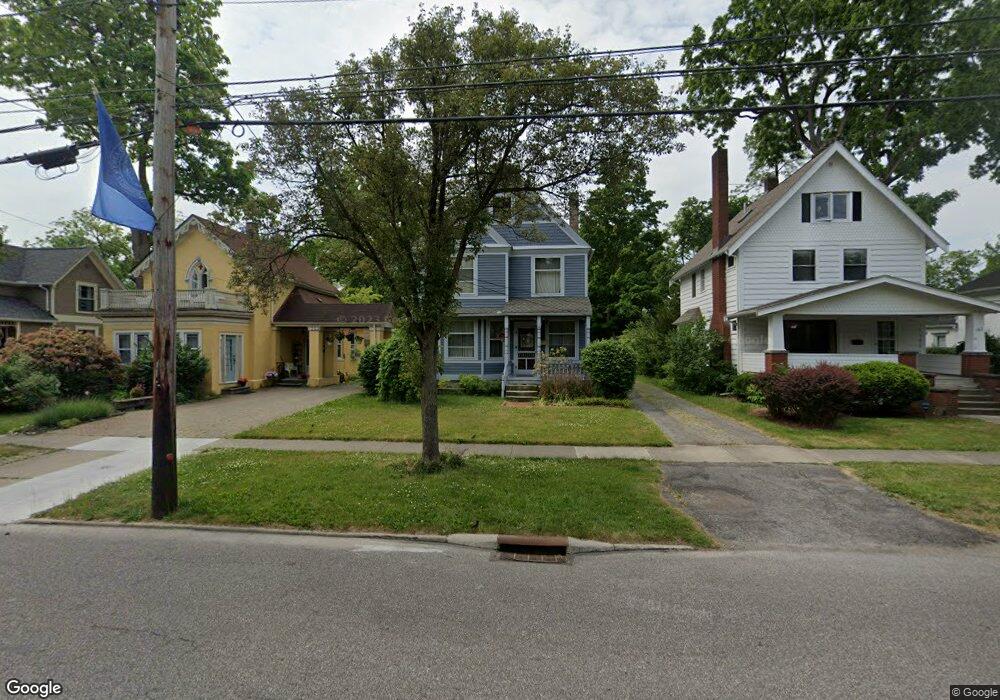
This home is located at 146 E Bridge St, Berea, OH 44017 and is currently estimated at $274,000, approximately $149 per square foot. 146 E Bridge St is a home located in Cuyahoga County with nearby schools including Grindstone Elementary School, Berea-Midpark Middle School, and Berea-Midpark High School.
Ownership History
Date
Name
Owned For
Owner Type
Purchase Details
Closed on
Jan 23, 2007
Sold by
Danzey Philip F and Danzey Karen V
Bought by
Kopkas Jeffrey J and Kopkas Carol Brewer
Current Estimated Value
Purchase Details
Closed on
Jan 2, 2007
Sold by
Kopkas Jeffrey J and Kopkas Carol Brewer
Bought by
Kopkas Jeffrey J and Kopkas Carol Brewer
Purchase Details
Closed on
Jan 28, 1994
Sold by
Brewer Clair H J R
Bought by
Kopkas Jeffrey J
Purchase Details
Closed on
Aug 20, 1991
Sold by
Brewer Clair H
Bought by
Brewer Clair H J R
Purchase Details
Closed on
Jan 21, 1987
Sold by
Norton J Frederick
Bought by
Brewer Clair H
Purchase Details
Closed on
Aug 14, 1985
Sold by
Norton Norton J J and Norton Barbara
Bought by
Norton J Frederick
Purchase Details
Closed on
Jan 1, 1975
Bought by
Norton Norton J and Norton Barbara
Create a Home Valuation Report for This Property
The Home Valuation Report is an in-depth analysis detailing your home's value as well as a comparison with similar homes in the area
Home Values in the Area
Average Home Value in this Area
Purchase History
| Date | Buyer | Sale Price | Title Company |
|---|---|---|---|
| Kopkas Jeffrey J | -- | Premier Title Agency Ltd | |
| Kopkas Jeffrey J | -- | Premier Title Agency Ltd | |
| Kopkas Jeffrey J | -- | -- | |
| Brewer Clair H J R | $1,000 | -- | |
| Brewer Clair H | $65,000 | -- | |
| Norton J Frederick | -- | -- | |
| Norton Norton J | -- | -- |
Source: Public Records
Tax History
| Year | Tax Paid | Tax Assessment Tax Assessment Total Assessment is a certain percentage of the fair market value that is determined by local assessors to be the total taxable value of land and additions on the property. | Land | Improvement |
|---|---|---|---|---|
| 2025 | $5,050 | $87,185 | $11,970 | $75,215 |
| 2024 | $5,038 | $87,185 | $11,970 | $75,215 |
| 2023 | $4,276 | $61,920 | $10,990 | $50,930 |
| 2022 | $4,250 | $61,920 | $10,990 | $50,930 |
| 2021 | $4,213 | $61,920 | $10,990 | $50,930 |
| 2020 | $4,025 | $52,470 | $9,310 | $43,160 |
| 2019 | $3,917 | $149,900 | $26,600 | $123,300 |
| 2018 | $3,893 | $52,470 | $9,310 | $43,160 |
| 2017 | $3,655 | $45,680 | $8,750 | $36,930 |
| 2016 | $3,628 | $45,680 | $8,750 | $36,930 |
| 2015 | $3,570 | $45,680 | $8,750 | $36,930 |
| 2014 | $3,570 | $47,570 | $9,100 | $38,470 |
Source: Public Records
Map
Nearby Homes
- 57 Riverside Dr
- 49 Monroe St
- 0 E Bagley Rd Unit 5111166
- 275 Quarrystone Ln
- 7640 S Eastland Rd
- 143 Baker St
- 584 Eastland Rd
- 56 3rd Ave
- 333 Parkway Dr
- 160 Marian Ln Unit 6A
- 169 Kempton Dr
- 146 Marian Ln
- 7400 Engle Rd
- 380 Adrian Dr
- 659 Wesley Dr
- 53 Greenfield Ct
- 347 Beeler Dr
- 8036 Fair Rd
- 7256 Markal Dr
- 428 Park Place
- 150 E Bridge St
- 142 E Bridge St
- 156 E Bridge St
- 136 E Bridge St
- 0 E Bridge St
- 135 Coe St
- 132 E Bridge St
- 147 E Bridge St
- 124 E Bridge St
- 157 E Bridge St
- 168 E Bridge St
- 131 E Bridge St
- 24 Adams St
- 26 Adams St
- 125 E Bridge St
- 163 E Bridge St
- 169 E Bridge St
- 121 E Bridge St
- 34 Adams St
- 175 E Bridge St
Your Personal Tour Guide
Ask me questions while you tour the home.