146 E Maple Ave Villa Park, IL 60181
Estimated Value: $235,000 - $339,000
3
Beds
2
Baths
1,146
Sq Ft
$267/Sq Ft
Est. Value
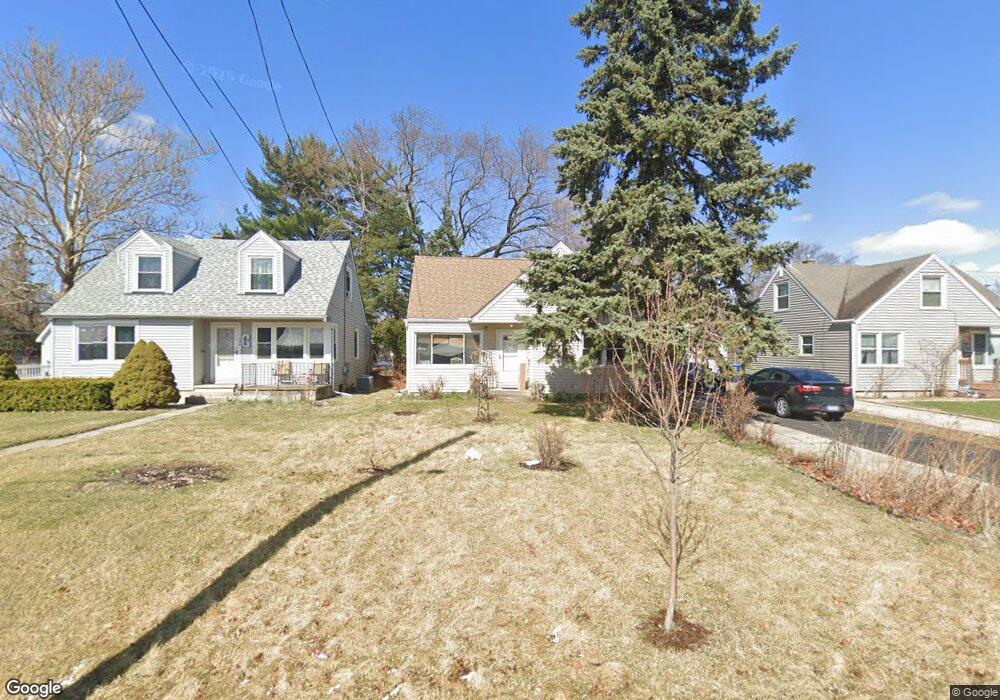
About This Home
This home is located at 146 E Maple Ave, Villa Park, IL 60181 and is currently estimated at $305,965, approximately $266 per square foot. 146 E Maple Ave is a home located in DuPage County with nearby schools including North Elementary School, Jefferson Middle School, and Willowbrook High School.
Ownership History
Date
Name
Owned For
Owner Type
Purchase Details
Closed on
Oct 14, 2013
Sold by
Wheeler Scott W and Wheeler Alexandra K
Bought by
Wheeler Alexandra L
Current Estimated Value
Purchase Details
Closed on
Oct 24, 2011
Sold by
Ross Theresa M and Lindquist Ashley T
Bought by
Wheeler Alexandra K and Wheeler Scott W
Home Financials for this Owner
Home Financials are based on the most recent Mortgage that was taken out on this home.
Original Mortgage
$79,920
Outstanding Balance
$54,482
Interest Rate
4.09%
Mortgage Type
New Conventional
Estimated Equity
$251,483
Purchase Details
Closed on
Apr 4, 2001
Sold by
Willer Dorothy F
Bought by
Lindquist Theresa M
Home Financials for this Owner
Home Financials are based on the most recent Mortgage that was taken out on this home.
Original Mortgage
$123,300
Interest Rate
7.13%
Mortgage Type
FHA
Create a Home Valuation Report for This Property
The Home Valuation Report is an in-depth analysis detailing your home's value as well as a comparison with similar homes in the area
Home Values in the Area
Average Home Value in this Area
Purchase History
| Date | Buyer | Sale Price | Title Company |
|---|---|---|---|
| Wheeler Alexandra L | -- | None Available | |
| Wheeler Alexandra K | $100,000 | Pntn | |
| Lindquist Theresa M | $156,500 | Ticor Title |
Source: Public Records
Mortgage History
| Date | Status | Borrower | Loan Amount |
|---|---|---|---|
| Open | Wheeler Alexandra K | $79,920 | |
| Previous Owner | Lindquist Theresa M | $123,300 |
Source: Public Records
Tax History
| Year | Tax Paid | Tax Assessment Tax Assessment Total Assessment is a certain percentage of the fair market value that is determined by local assessors to be the total taxable value of land and additions on the property. | Land | Improvement |
|---|---|---|---|---|
| 2024 | $5,670 | $83,019 | $18,449 | $64,570 |
| 2023 | $5,385 | $76,770 | $17,060 | $59,710 |
| 2022 | $5,271 | $73,790 | $16,400 | $57,390 |
| 2021 | $5,052 | $71,950 | $15,990 | $55,960 |
| 2020 | $4,929 | $70,370 | $15,640 | $54,730 |
| 2019 | $4,594 | $66,900 | $14,870 | $52,030 |
| 2018 | $4,272 | $59,190 | $13,160 | $46,030 |
| 2017 | $4,161 | $56,400 | $12,540 | $43,860 |
| 2016 | $4,033 | $53,130 | $11,810 | $41,320 |
| 2015 | $3,962 | $49,490 | $11,000 | $38,490 |
| 2014 | $4,974 | $60,820 | $23,540 | $37,280 |
| 2013 | $4,742 | $61,670 | $23,870 | $37,800 |
Source: Public Records
Map
Nearby Homes
- 58 E Division St
- 235 N Ardmore Ave
- 327 N Princeton Ave Unit 9
- 169 S Villa Ave
- 528 N Ardmore Ave
- 237 S Villa Ave
- 17W517 Manor Ln
- 204 E Hill St
- 526 N Harvard Ave
- 108 S Cornell Ave
- 192 N Bonnie Brae Ave
- 600 N Iowa Ave
- 417 W Terrace St
- 1044 S Ellsworth Ave
- 255 S West Ave Unit 214
- 232 S Oakland Ave
- 18W570 W North Ave
- 395 S Scott St
- 508 W Alma St
- 215 S Sunnyside Ave
- 142 E Maple Ave
- 150 E Maple Ave
- 138 E Maple Ave
- 154 E Maple Ave
- 328 N Summit Ave
- 134 E Maple Ave
- 326 N Summit Ave
- 130 E Maple Ave
- 204 E Maple Ave
- 139 E Maple Ave
- 135 E Maple Ave
- 324 N Summit Ave
- 126 E Maple Ave
- 131 E Maple Ave
- 206 E Maple Ave
- 321 N Summit Ave
- 127 E Maple Ave
- 314 N Summit Ave
- 210 E Maple Ave
- 207 E Maple Ave
Your Personal Tour Guide
Ask me questions while you tour the home.