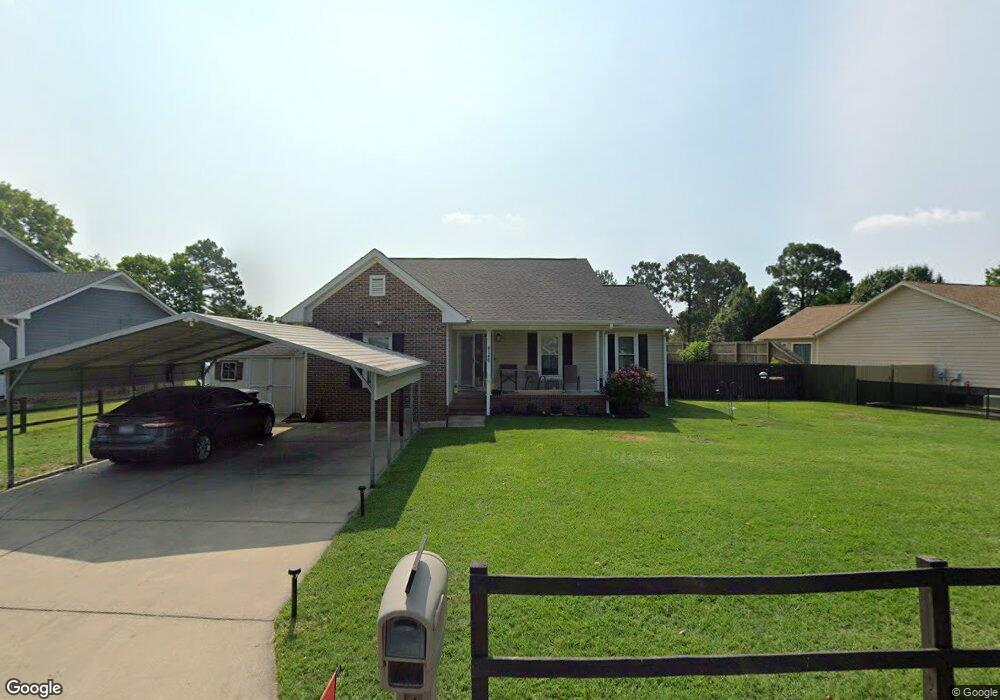
146 E Twelve Oaks Rd Raeford, NC 28376
Estimated Value: $232,000 - $273,746
3
Beds
2
Baths
1,680
Sq Ft
$153/Sq Ft
Est. Value
About This Home
This home is located at 146 E Twelve Oaks Rd, Raeford, NC 28376 and is currently estimated at $257,187, approximately $153 per square foot. 146 E Twelve Oaks Rd is a home located in Hoke County with nearby schools including Sandy Grove Elementary School, Sandy Grove Middle School, and Hoke County High.
Ownership History
Date
Name
Owned For
Owner Type
Purchase Details
Closed on
Jul 21, 2017
Sold by
Mccormick Joshua Dean and Mccormick Farrah Michelle
Bought by
Mccormick Joshua Dean
Current Estimated Value
Purchase Details
Closed on
Apr 26, 2010
Sold by
Chenetz Ian K and Chenetz Lori
Bought by
Mccormick Joshua D and Mccormick Farrah M
Home Financials for this Owner
Home Financials are based on the most recent Mortgage that was taken out on this home.
Original Mortgage
$152,995
Interest Rate
4.94%
Purchase Details
Closed on
Nov 28, 2007
Sold by
Haynes Debbie L
Bought by
Chenetz Ian K and Chenetz Lori
Home Financials for this Owner
Home Financials are based on the most recent Mortgage that was taken out on this home.
Original Mortgage
$128,700
Interest Rate
6.36%
Create a Home Valuation Report for This Property
The Home Valuation Report is an in-depth analysis detailing your home's value as well as a comparison with similar homes in the area
Home Values in the Area
Average Home Value in this Area
Purchase History
| Date | Buyer | Sale Price | Title Company |
|---|---|---|---|
| Mccormick Joshua Dean | -- | None Available | |
| Mccormick Joshua D | $150,000 | -- | |
| Chenetz Ian K | $126,000 | None Available |
Source: Public Records
Mortgage History
| Date | Status | Borrower | Loan Amount |
|---|---|---|---|
| Previous Owner | Mccormick Joshua D | $152,995 | |
| Previous Owner | Chenetz Ian K | $128,700 |
Source: Public Records
Tax History Compared to Growth
Tax History
| Year | Tax Paid | Tax Assessment Tax Assessment Total Assessment is a certain percentage of the fair market value that is determined by local assessors to be the total taxable value of land and additions on the property. | Land | Improvement |
|---|---|---|---|---|
| 2024 | $1,215 | $177,360 | $27,820 | $149,540 |
| 2023 | $1,122 | $165,990 | $27,820 | $138,170 |
| 2022 | $1,102 | $165,990 | $27,820 | $138,170 |
| 2021 | $1,006 | $151,380 | $26,500 | $124,880 |
| 2020 | $1,022 | $151,380 | $26,500 | $124,880 |
| 2019 | $1,022 | $151,380 | $26,500 | $124,880 |
| 2018 | $1,022 | $151,380 | $26,500 | $124,880 |
| 2017 | $1,400 | $151,380 | $26,500 | $124,880 |
| 2016 | $1,374 | $151,380 | $26,500 | $124,880 |
| 2015 | $1,374 | $151,380 | $26,500 | $124,880 |
| 2014 | $1,351 | $151,380 | $26,500 | $124,880 |
| 2013 | -- | $124,080 | $19,000 | $105,080 |
Source: Public Records
Map
Nearby Homes
- 162 E Twelve Oaks Rd
- 311 Kernstown Rd
- 121 Michael Dr
- 230 Michael Dr
- 2713 Crestridge Ct
- 7344 Mariners Landing Dr
- 658 Copper Creek Dr
- 3523 Farm Circle Rd
- 9701 Rockfish Rd
- 7091 Lamplighter Dr
- 3516 Farm Circle Rd
- 4716 Ritson Ln
- 3510 Farm Circle Rd
- 7248 Cayman Dr
- 3021 S Kilchattan Dr
- 2863 Aristocrat Ln
- 6860 Harvest Ct
- 146 E Twelve Okas
- 154 E Twelve Oaks Rd
- 140 E Twelve Oaks Rd
- 160 E Twelve Oaks Rd
- 119 Hickman Ct
- 132 E Twelve Oaks Rd
- 141 Hickman Ct
- 123 Hickman Ct
- 143 E Twelve Oaks Rd
- 149 E Twelve Oaks Rd
- 129 Hickman Ct
- 135 Hickman Ct
- 147 Hickman Ct
- 157 E 12 Oaks Rd
- 151 E Twelve Oaks Rd
- 137 E Twelve Oaks Rd
- 157 E Twelve Oaks Rd
- 161 E Twelve Oaks Rd
- 153 Hickman Ct
- 170 E Twelve Oaks Rd