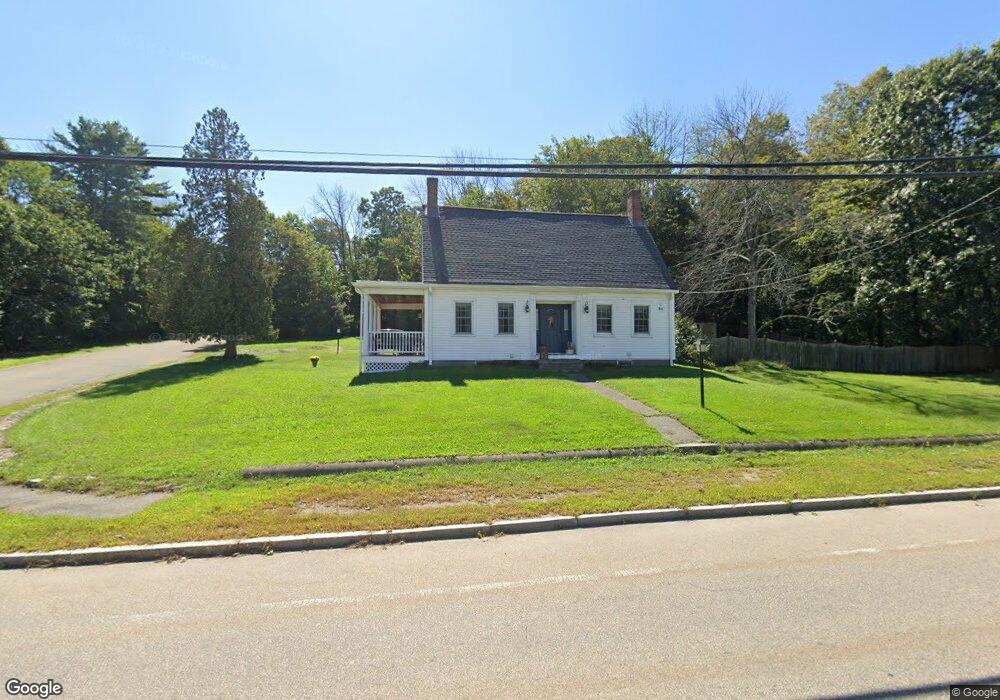
146 East St Wrentham, MA 02093
Estimated Value: $755,795 - $1,139,000
3
Beds
2
Baths
3,297
Sq Ft
$275/Sq Ft
Est. Value
About This Home
This home is located at 146 East St, Wrentham, MA 02093 and is currently estimated at $907,449, approximately $275 per square foot. 146 East St is a home located in Norfolk County with nearby schools including Delaney Elementary School, Charles E Roderick, and The Sage School.
Ownership History
Date
Name
Owned For
Owner Type
Purchase Details
Closed on
Oct 7, 2025
Sold by
Mccarthy Linda J
Bought by
Linda J Mccarthy Ret and Mccarthy
Current Estimated Value
Purchase Details
Closed on
Dec 29, 2021
Sold by
Mccarthy John L and Mccarthy Linda J
Bought by
Mccarthy Linda J
Purchase Details
Closed on
Jul 7, 1994
Sold by
Stoffolano Sharon
Bought by
Mccarthy John L and Mccarthy Linda J
Home Financials for this Owner
Home Financials are based on the most recent Mortgage that was taken out on this home.
Original Mortgage
$80,000
Interest Rate
8.51%
Mortgage Type
Purchase Money Mortgage
Create a Home Valuation Report for This Property
The Home Valuation Report is an in-depth analysis detailing your home's value as well as a comparison with similar homes in the area
Home Values in the Area
Average Home Value in this Area
Purchase History
| Date | Buyer | Sale Price | Title Company |
|---|---|---|---|
| Linda J Mccarthy Ret | -- | -- | |
| Mccarthy Linda J | -- | None Available | |
| Mccarthy John L | $157,000 | -- |
Source: Public Records
Mortgage History
| Date | Status | Borrower | Loan Amount |
|---|---|---|---|
| Previous Owner | Mccarthy John L | $110,000 | |
| Previous Owner | Mccarthy John L | $10,000 | |
| Previous Owner | Mccarthy John L | $80,000 | |
| Previous Owner | Mccarthy John L | $125,000 |
Source: Public Records
Tax History Compared to Growth
Tax History
| Year | Tax Paid | Tax Assessment Tax Assessment Total Assessment is a certain percentage of the fair market value that is determined by local assessors to be the total taxable value of land and additions on the property. | Land | Improvement |
|---|---|---|---|---|
| 2025 | $7,415 | $639,800 | $264,800 | $375,000 |
| 2024 | $7,258 | $604,800 | $264,800 | $340,000 |
| 2023 | $7,523 | $596,100 | $240,800 | $355,300 |
| 2022 | $6,953 | $508,600 | $216,800 | $291,800 |
| 2021 | $6,768 | $481,000 | $193,600 | $287,400 |
| 2020 | $6,622 | $464,700 | $176,800 | $287,900 |
| 2019 | $6,206 | $439,500 | $160,700 | $278,800 |
| 2018 | $5,707 | $400,800 | $160,900 | $239,900 |
| 2017 | $5,349 | $375,400 | $157,800 | $217,600 |
| 2016 | $5,094 | $356,700 | $153,200 | $203,500 |
| 2015 | $4,916 | $328,200 | $147,300 | $180,900 |
| 2014 | $4,838 | $316,000 | $141,700 | $174,300 |
Source: Public Records
Map
Nearby Homes
- 10 Nature View Dr
- 15 Nature View Dr
- 362 East St
- 1 Lorraine Metcalf Dr
- 319 Taunton St
- 270 Dedham St
- 131 Creek St Unit 7
- 11 Earle Stewart Ln
- Lot 3 - 14 Earle Stewart Ln
- Lot 1 - Blueberry 2 Car Plan at King Philip Estates
- Lot 8 - Blueberry 2 Car Plan at King Philip Estates
- Lot 5 - Hughes 2 car Plan at King Philip Estates
- Lot 6 - Blueberry 3 Car Plan at King Philip Estates
- Lot 2 - Camden 2 Car Plan at King Philip Estates
- Lot 7 - Cedar Plan at King Philip Estates
- Lot 4 - Hemingway 2 Car Plan at King Philip Estates
- Lot 3 - Blueberry 2 Car Plan at King Philip Estates
- 65 Pond St
- 120 Hawes St
- 570 Franklin St