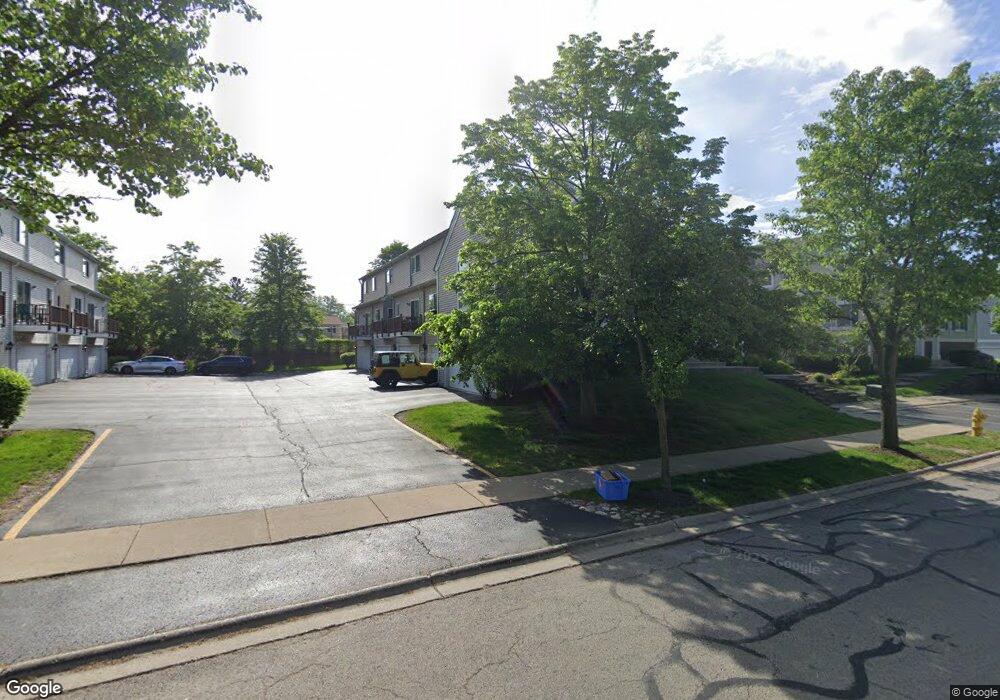
146 Enclave Cir Unit 1 Bolingbrook, IL 60440
East Bolingbrook NeighborhoodEstimated Value: $276,000 - $317,000
--
Bed
2
Baths
1,517
Sq Ft
$191/Sq Ft
Est. Value
About This Home
This home is located at 146 Enclave Cir Unit 1, Bolingbrook, IL 60440 and is currently estimated at $289,978, approximately $191 per square foot. 146 Enclave Cir Unit 1 is a home located in Will County with nearby schools including John R Tibbott Elementary School, Brooks Middle School, and Hubert H Humphrey Middle School.
Ownership History
Date
Name
Owned For
Owner Type
Purchase Details
Closed on
Jun 6, 2018
Sold by
Hartman Rachel and Staats Andrew
Bought by
Munir Shamim and Muneer Mrizwan
Current Estimated Value
Purchase Details
Closed on
Apr 30, 2008
Sold by
Hagenauer Gary and Hagenauer Christine
Bought by
Hartman Rachel and Staats Andrew
Home Financials for this Owner
Home Financials are based on the most recent Mortgage that was taken out on this home.
Original Mortgage
$167,200
Interest Rate
5.93%
Mortgage Type
Unknown
Purchase Details
Closed on
Aug 8, 2003
Sold by
The Enclave Llc
Bought by
Hagenauer Gary and Hagenauer Christine
Home Financials for this Owner
Home Financials are based on the most recent Mortgage that was taken out on this home.
Original Mortgage
$180,600
Interest Rate
6.04%
Mortgage Type
FHA
Create a Home Valuation Report for This Property
The Home Valuation Report is an in-depth analysis detailing your home's value as well as a comparison with similar homes in the area
Home Values in the Area
Average Home Value in this Area
Purchase History
| Date | Buyer | Sale Price | Title Company |
|---|---|---|---|
| Munir Shamim | $185,678 | First American Title | |
| Hartman Rachel | $209,000 | First American Title | |
| Hagenauer Gary | $186,500 | Ticor Title |
Source: Public Records
Mortgage History
| Date | Status | Borrower | Loan Amount |
|---|---|---|---|
| Previous Owner | Hartman Rachel | $167,200 | |
| Previous Owner | Hagenauer Gary | $180,600 |
Source: Public Records
Tax History Compared to Growth
Tax History
| Year | Tax Paid | Tax Assessment Tax Assessment Total Assessment is a certain percentage of the fair market value that is determined by local assessors to be the total taxable value of land and additions on the property. | Land | Improvement |
|---|---|---|---|---|
| 2024 | $7,125 | $77,147 | $17,224 | $59,923 |
| 2023 | $7,125 | $69,415 | $15,498 | $53,917 |
| 2022 | $6,065 | $61,354 | $13,698 | $47,656 |
| 2021 | $5,775 | $57,367 | $12,808 | $44,559 |
| 2020 | $5,612 | $55,481 | $12,387 | $43,094 |
| 2019 | $5,345 | $51,803 | $11,566 | $40,237 |
| 2018 | $4,950 | $47,657 | $10,640 | $37,017 |
| 2017 | $4,734 | $45,172 | $10,085 | $35,087 |
| 2016 | $3,973 | $43,000 | $9,600 | $33,400 |
| 2015 | $4,739 | $40,000 | $8,900 | $31,100 |
| 2014 | $4,739 | $40,000 | $8,900 | $31,100 |
| 2013 | $4,739 | $50,000 | $11,100 | $38,900 |
Source: Public Records
Map
Nearby Homes
- 156 Monterey Dr
- 219 Monterey Dr
- 255 Braemar Glen
- 124 W Briarcliff Rd
- 131 Monticello Cir
- 118 Camelot Way
- 112 Brook Ct
- 325 Rockhurst Rd
- 316 Bedford Rd
- 220 Falcon Ridge Way
- 322 Rockhurst Rd
- 156 Cypress Dr
- 2 Ava Ct
- 220 N Ashbury Ave
- 492 Ridge Ln
- 490 Ridge Ln
- 488 Ridge Ln
- 458 Ridge Ln
- 462 Ridge Ln
- 157 Vernon Dr Unit 6
- 146 Enclave Cir
- 146 Enclave Cir Unit E
- 148 Enclave Cir Unit A
- 146 Enclave Cir Unit C
- 148 Enclave Cir Unit C
- 148 Enclave Cir Unit B
- 146 Enclave Cir Unit D
- 146 Enclave Cir Unit B
- 146 Enclave Cir Unit A
- 148 Enclave Cir
- 148 Enclave Cir Unit E
- 148
- 150 Enclave Cir Unit 5
- 150 Enclave Cir Unit D
- 150 Enclave Cir Unit C
- 150 Enclave Cir Unit B
- 150 Enclave Cir Unit A
- 150 Enclave Cir Unit E
- 149 Malibu Dr
- 144 Enclave Cir Unit C