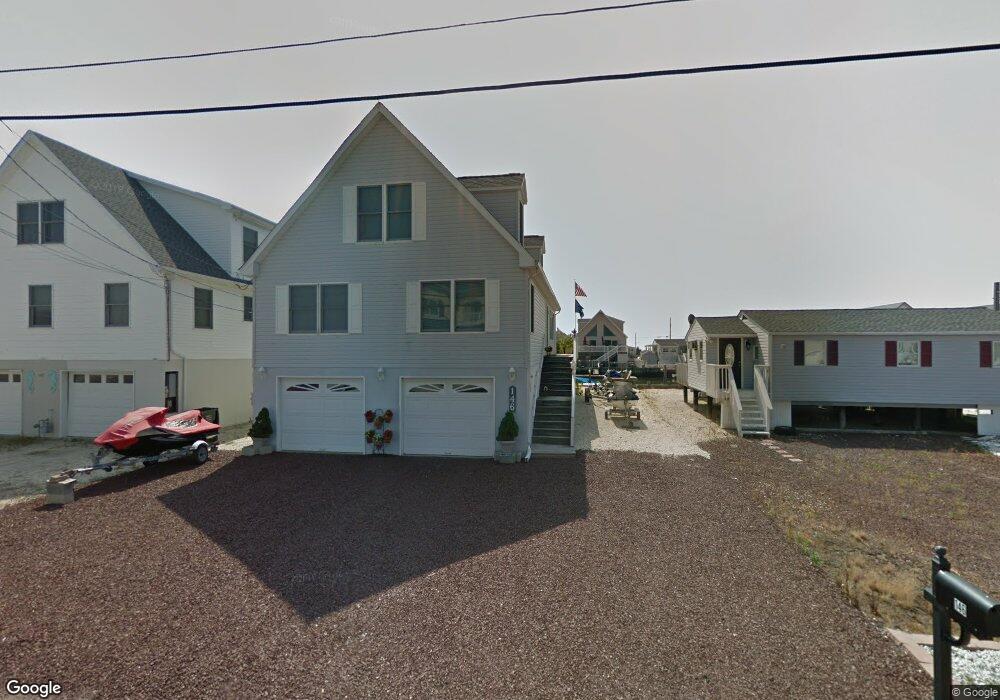
146 Flamingo Rd Tuckerton, NJ 08087
Estimated Value: $461,000 - $731,000
4
Beds
2
Baths
3,110
Sq Ft
$202/Sq Ft
Est. Value
About This Home
This home is located at 146 Flamingo Rd, Tuckerton, NJ 08087 and is currently estimated at $628,955, approximately $202 per square foot. 146 Flamingo Rd is a home located in Ocean County with nearby schools including Tuckerton Elementary School, Pinelands Regional Junior High School, and Pinelands Regional High School.
Ownership History
Date
Name
Owned For
Owner Type
Purchase Details
Closed on
Jul 30, 2025
Sold by
Peterson Steven C and Peterson Brian D
Bought by
Peterson Steven C
Current Estimated Value
Home Financials for this Owner
Home Financials are based on the most recent Mortgage that was taken out on this home.
Original Mortgage
$227,742
Outstanding Balance
$227,546
Interest Rate
6.74%
Mortgage Type
Seller Take Back
Estimated Equity
$401,409
Purchase Details
Closed on
Dec 12, 2024
Sold by
Peterson Steven C and Peterson Doris M
Bought by
Peterson Steven C and Peterson Brian D
Purchase Details
Closed on
Jan 13, 2012
Sold by
Peterson Doris M
Bought by
Peterson Doris M and Peterson Steven C
Purchase Details
Closed on
Jan 11, 2008
Sold by
Peterson Nelson C and Peterson Doris M
Bought by
Peterson Nelson C and Peterson Doris M
Create a Home Valuation Report for This Property
The Home Valuation Report is an in-depth analysis detailing your home's value as well as a comparison with similar homes in the area
Home Values in the Area
Average Home Value in this Area
Purchase History
| Date | Buyer | Sale Price | Title Company |
|---|---|---|---|
| Peterson Steven C | $458,000 | Surety Title | |
| Peterson Steven C | $458,000 | Surety Title | |
| Peterson Steven C | -- | None Listed On Document | |
| Peterson Steven C | -- | None Listed On Document | |
| Peterson Steven C | -- | None Listed On Document | |
| Peterson Doris M | -- | None Available | |
| Peterson Nelson C | -- | None Available |
Source: Public Records
Mortgage History
| Date | Status | Borrower | Loan Amount |
|---|---|---|---|
| Open | Peterson Steven C | $227,742 | |
| Closed | Peterson Steven C | $227,742 |
Source: Public Records
Tax History Compared to Growth
Tax History
| Year | Tax Paid | Tax Assessment Tax Assessment Total Assessment is a certain percentage of the fair market value that is determined by local assessors to be the total taxable value of land and additions on the property. | Land | Improvement |
|---|---|---|---|---|
| 2025 | $10,527 | $339,800 | $102,400 | $237,400 |
| 2024 | $9,339 | $339,800 | $102,400 | $237,400 |
| 2023 | $8,728 | $339,800 | $102,400 | $237,400 |
| 2022 | $8,978 | $339,800 | $102,400 | $237,400 |
| 2021 | $8,006 | $339,800 | $102,400 | $237,400 |
| 2020 | $8,903 | $339,800 | $102,400 | $237,400 |
| 2019 | $8,886 | $339,800 | $102,400 | $237,400 |
| 2018 | $8,291 | $325,000 | $160,000 | $165,000 |
| 2017 | $7,904 | $325,000 | $160,000 | $165,000 |
| 2016 | $7,241 | $325,000 | $160,000 | $165,000 |
| 2015 | $7,150 | $325,000 | $160,000 | $165,000 |
| 2014 | $7,105 | $325,000 | $160,000 | $165,000 |
Source: Public Records
Map
Nearby Homes
- 186 Flamingo Rd
- 112 Curlew Rd
- 348 Kingfisher Rd
- 389 Kingfisher Rd
- 73 Little Egg Harbor Blvd
- 163 Flamingo Rd
- 233 Heron Rd
- 370 Kingfisher Rd
- 267 Heron Rd
- 1019 S Green St
- 27 Parker Rd
- 25 Carroll Ave
- 79 Dolphin Rd
- 604 S Green St
- 476 S Green St
- 56 Flax Isle Dr
- 67 Flax Isle Dr
- 40 Daddy Tucker Dr
- 5 Hunter Dr
- 31 Daddy Tucker Dr
- 147 Flamingo Rd
- 148 Flamingo Rd
- 143 Flamingo Rd
- 149 Flamingo Rd
- 178 Flamingo Rd
- 180 Flamingo Rd
- 177 Flamingo Rd
- 181 Flamingo Rd
- 176 Flamingo Rd
- 150 Flamingo Rd
- 142 Flamingo Rd
- 114 Curlew Rd
- 182 Flamingo Rd
- 116 Curlew Rd
- 113 Curlew Rd
- 175 Flamingo Rd
- 151 Flamingo Rd
- 141 Flamingo Rd
- 117 Curlew Rd
- 183 Flamingo Rd