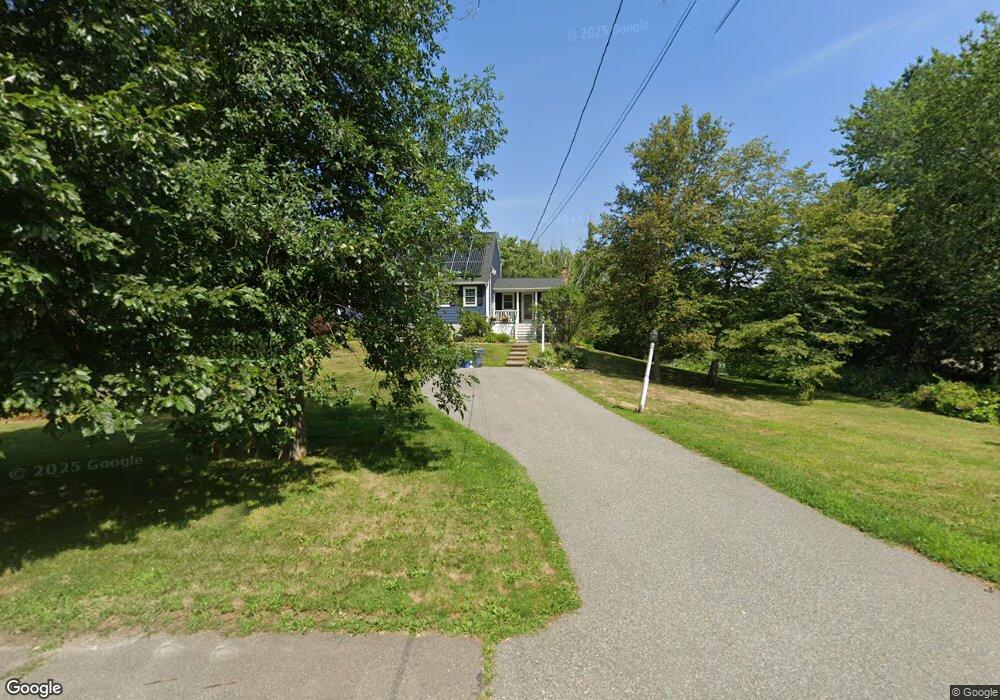
146 Hale St Newburyport, MA 01950
Estimated Value: $805,000 - $1,000,000
3
Beds
2
Baths
1,742
Sq Ft
$506/Sq Ft
Est. Value
About This Home
This home is located at 146 Hale St, Newburyport, MA 01950 and is currently estimated at $881,245, approximately $505 per square foot. 146 Hale St is a home located in Essex County with nearby schools including Francis T. Bresnahan Elementary School, Edward G. Molin Elementary School, and Rupert A. Nock Middle School.
Ownership History
Date
Name
Owned For
Owner Type
Purchase Details
Closed on
Nov 30, 1992
Sold by
Nassor Robert and Nassor Madeline S
Bought by
Bradley Stephen C and Bradley Judith E
Current Estimated Value
Purchase Details
Closed on
Jul 31, 1987
Sold by
Tutrone Donna M
Bought by
Nassor Robert
Create a Home Valuation Report for This Property
The Home Valuation Report is an in-depth analysis detailing your home's value as well as a comparison with similar homes in the area
Home Values in the Area
Average Home Value in this Area
Purchase History
| Date | Buyer | Sale Price | Title Company |
|---|---|---|---|
| Bradley Stephen C | $150,000 | -- | |
| Nassor Robert | $174,000 | -- |
Source: Public Records
Mortgage History
| Date | Status | Borrower | Loan Amount |
|---|---|---|---|
| Open | Nassor Robert | $307,985 | |
| Closed | Nassor Robert | $322,400 |
Source: Public Records
Tax History Compared to Growth
Tax History
| Year | Tax Paid | Tax Assessment Tax Assessment Total Assessment is a certain percentage of the fair market value that is determined by local assessors to be the total taxable value of land and additions on the property. | Land | Improvement |
|---|---|---|---|---|
| 2025 | $7,783 | $812,400 | $405,000 | $407,400 |
| 2024 | $7,389 | $741,100 | $368,200 | $372,900 |
| 2023 | $7,052 | $656,600 | $320,100 | $336,500 |
| 2022 | $6,519 | $542,800 | $266,800 | $276,000 |
| 2021 | $6,462 | $511,200 | $242,500 | $268,700 |
| 2020 | $6,351 | $494,600 | $242,500 | $252,100 |
| 2019 | $6,227 | $476,100 | $242,500 | $233,600 |
| 2018 | $6,072 | $457,900 | $231,000 | $226,900 |
| 2017 | $5,887 | $437,700 | $220,100 | $217,600 |
| 2016 | $5,515 | $411,900 | $209,600 | $202,300 |
| 2015 | $5,237 | $392,600 | $209,600 | $183,000 |
Source: Public Records
Map
Nearby Homes