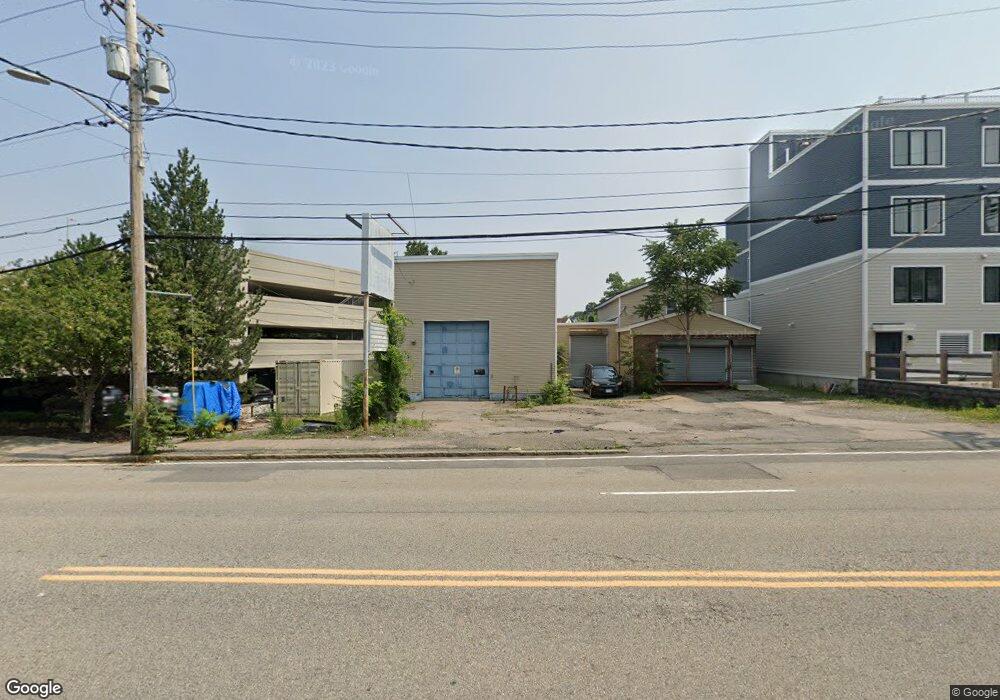
146 Hancock St Quincy, MA 02171
North Quincy Neighborhood
--
Bed
1
Bath
4,308
Sq Ft
8,276
Sq Ft Lot
About This Home
This home is located at 146 Hancock St, Quincy, MA 02171. 146 Hancock St is a home located in Norfolk County with nearby schools including Squantum Elementary School, Atlantic Middle School, and North Quincy High School.
Ownership History
Date
Name
Owned For
Owner Type
Purchase Details
Closed on
Jun 13, 2013
Sold by
146 Hancock Llc
Bought by
Lyc Hancock Llc
Home Financials for this Owner
Home Financials are based on the most recent Mortgage that was taken out on this home.
Original Mortgage
$510,000
Outstanding Balance
$361,164
Interest Rate
3.39%
Mortgage Type
Commercial
Purchase Details
Closed on
Jun 23, 2004
Sold by
Devine Gordon S
Bought by
146 Hancock Llc
Home Financials for this Owner
Home Financials are based on the most recent Mortgage that was taken out on this home.
Original Mortgage
$287,500
Interest Rate
6.32%
Mortgage Type
Commercial
Create a Home Valuation Report for This Property
The Home Valuation Report is an in-depth analysis detailing your home's value as well as a comparison with similar homes in the area
Home Values in the Area
Average Home Value in this Area
Purchase History
| Date | Buyer | Sale Price | Title Company |
|---|---|---|---|
| Lyc Hancock Llc | $495,220 | -- | |
| 146 Hancock Llc | $650,000 | -- |
Source: Public Records
Mortgage History
| Date | Status | Borrower | Loan Amount |
|---|---|---|---|
| Open | Lyc Hancock Llc | $510,000 | |
| Previous Owner | 146 Hancock Llc | $287,500 |
Source: Public Records
Tax History Compared to Growth
Tax History
| Year | Tax Paid | Tax Assessment Tax Assessment Total Assessment is a certain percentage of the fair market value that is determined by local assessors to be the total taxable value of land and additions on the property. | Land | Improvement |
|---|---|---|---|---|
| 2025 | $16,613 | $722,000 | $299,000 | $423,000 |
| 2024 | $16,209 | $722,000 | $296,100 | $425,900 |
| 2023 | $14,803 | $667,400 | $293,000 | $374,400 |
| 2022 | $15,266 | $639,800 | $279,100 | $360,700 |
| 2021 | $15,319 | $632,500 | $276,300 | $356,200 |
| 2020 | $15,711 | $632,500 | $273,700 | $358,800 |
| 2019 | $15,571 | $618,400 | $270,900 | $347,500 |
| 2018 | $15,843 | $585,900 | $268,200 | $317,700 |
| 2017 | $13,382 | $466,100 | $260,300 | $205,800 |
| 2016 | $13,689 | $466,100 | $260,300 | $205,800 |
| 2015 | $14,268 | $471,500 | $260,300 | $211,200 |
| 2014 | $13,716 | $439,200 | $260,300 | $178,900 |
Source: Public Records
Map
Nearby Homes
- 68 Atlantic St
- 91 Atlantic St
- 133 Commander Shea Blvd Unit 315
- 133 Commander Shea Blvd Unit 609
- 133 Commander Shea Blvd Unit 620
- 133 Commander Shea Blvd Unit 204
- 45 Hancock St Unit 203
- 90 Quincy Shore Dr Unit 701
- 90 Quincy Shore Dr Unit 501
- 90 Shore Ave
- 60 Newbury St Unit 10
- 38 Walker St
- 138 Quincy Shore Dr Unit 170
- 85 E Squantum St Unit 10
- 148 Quincy Shore Dr Unit 43
- 175 Quincy Shore Dr Unit B24
- 201 Billings St
- 17 Holmes St Unit 2
- 17 Holmes St Unit 4
- 166 Quincy Shore Dr Unit 108
- 150 Hancock St
- 150 Hancock St Unit 2-202
- 150 Hancock St Unit 1-100
- 150 Hancock St Unit 202
- 150 Hancock St Unit 301
- 150 Hancock St Unit 201
- 150 Hancock St Unit 302
- 150 Hancock St Unit 102
- 150 Hancock St Unit 101
- 150 Hancock St Unit 104
- 150 Hancock St Unit 103
- 150 Hancock St Unit 200
- 150 Hancock St Unit 100
- 150 Hancock St Unit 203
- 150 Hancock St Unit 3
- 150 Hancock St Unit 300
- 150 Hancock St Unit 3303
- 141 Hancock St Unit 20
- 141 Hancock St Unit 14
- 141 Hancock St Unit 10