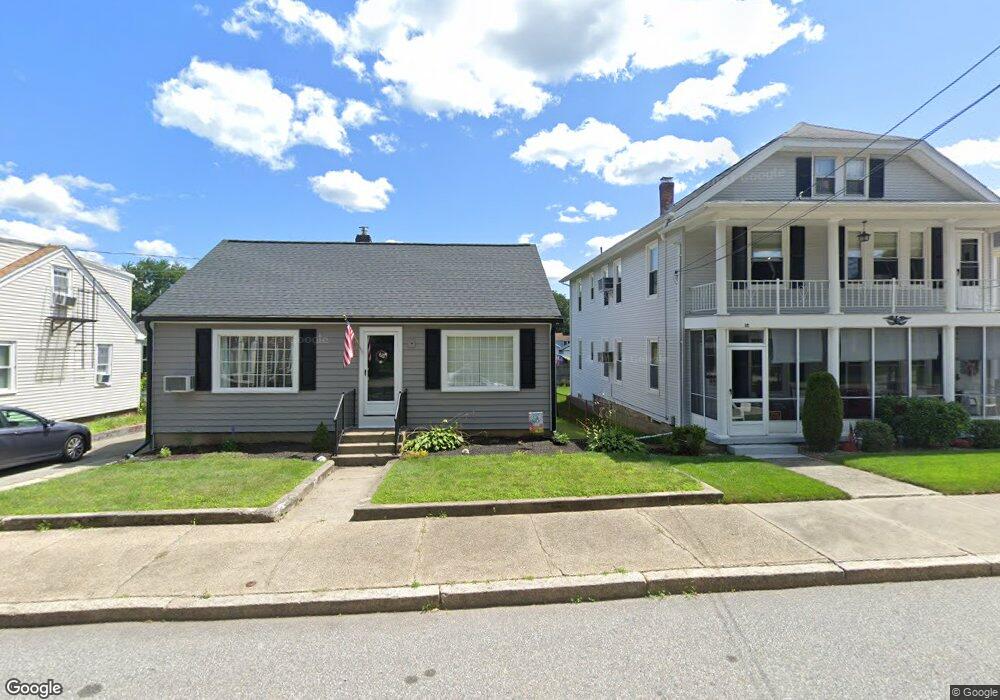
146 Jenckes St Woonsocket, RI 02895
Globe District NeighborhoodEstimated Value: $276,000 - $371,000
2
Beds
1
Bath
1,132
Sq Ft
$278/Sq Ft
Est. Value
About This Home
This home is located at 146 Jenckes St, Woonsocket, RI 02895 and is currently estimated at $315,032, approximately $278 per square foot. 146 Jenckes St is a home located in Providence County with nearby schools including Woonsocket High School, Founders Academy, and Beacon Charter School.
Ownership History
Date
Name
Owned For
Owner Type
Purchase Details
Closed on
Jan 31, 2014
Sold by
Benz-Fanning Judith
Bought by
Benz-Fanning Judith and Fanning Edward
Current Estimated Value
Purchase Details
Closed on
Dec 29, 2011
Sold by
Morin Theresa Y and Lawhead Diane F
Bought by
Benz-Fanning Judith
Home Financials for this Owner
Home Financials are based on the most recent Mortgage that was taken out on this home.
Original Mortgage
$111,100
Interest Rate
4%
Mortgage Type
Purchase Money Mortgage
Create a Home Valuation Report for This Property
The Home Valuation Report is an in-depth analysis detailing your home's value as well as a comparison with similar homes in the area
Home Values in the Area
Average Home Value in this Area
Purchase History
| Date | Buyer | Sale Price | Title Company |
|---|---|---|---|
| Benz-Fanning Judith | -- | -- | |
| Benz-Fanning Judith | $114,000 | -- | |
| Benz-Fanning Judith | -- | -- | |
| Benz-Fanning Judith | $114,000 | -- |
Source: Public Records
Mortgage History
| Date | Status | Borrower | Loan Amount |
|---|---|---|---|
| Previous Owner | Benz-Fanning Judith | $111,100 |
Source: Public Records
Tax History Compared to Growth
Tax History
| Year | Tax Paid | Tax Assessment Tax Assessment Total Assessment is a certain percentage of the fair market value that is determined by local assessors to be the total taxable value of land and additions on the property. | Land | Improvement |
|---|---|---|---|---|
| 2025 | $3,615 | $321,900 | $103,900 | $218,000 |
| 2024 | $3,421 | $235,300 | $92,200 | $143,100 |
| 2023 | $3,289 | $235,300 | $92,200 | $143,100 |
| 2022 | $3,289 | $235,300 | $92,200 | $143,100 |
| 2021 | $3,380 | $142,300 | $55,900 | $86,400 |
| 2020 | $3,415 | $142,300 | $55,900 | $86,400 |
| 2018 | $3,427 | $142,300 | $55,900 | $86,400 |
| 2017 | $3,386 | $112,500 | $45,300 | $67,200 |
| 2016 | $3,582 | $112,500 | $45,300 | $67,200 |
| 2015 | $4,115 | $112,500 | $45,300 | $67,200 |
| 2014 | $4,036 | $112,300 | $49,900 | $62,400 |
Source: Public Records
Map
Nearby Homes
- 295 Providence St
- 243 Transit St
- 40 Baxter St
- 124 Darwin St
- 80 Summit St
- 23 Middle St
- 257 Orchard St
- 182 Avenue C Unit 6
- 182 Avenue C
- 184 Avenue C Unit 6
- 184 Avenue C
- 184 Avenue C Unit 3
- 184 Avenue C Unit 1
- 184 Avenue C Unit 5
- 184 Avenue C Unit 2
- 184 Avenue C Unit 4
- 190 Coe St
- 604 Providence St
- 66 Providence St
- 27 Irene Blvd