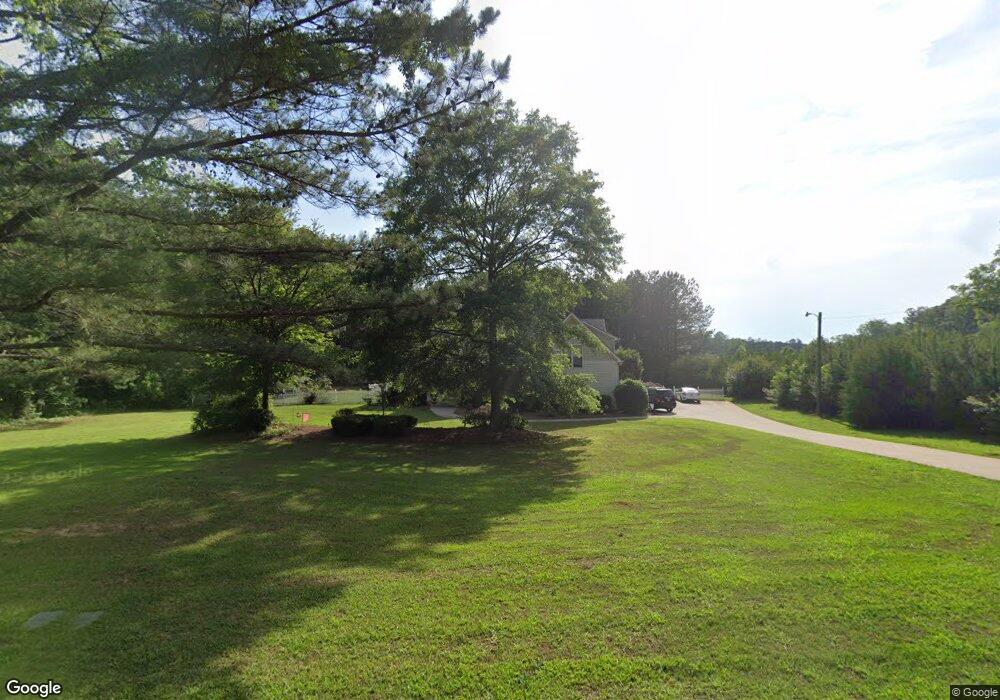
146 Joe Cox Rd Sharpsburg, GA 30277
Estimated Value: $347,484 - $455,000
3
Beds
2
Baths
2,130
Sq Ft
$187/Sq Ft
Est. Value
About This Home
This home is located at 146 Joe Cox Rd, Sharpsburg, GA 30277 and is currently estimated at $398,121, approximately $186 per square foot. 146 Joe Cox Rd is a home located in Coweta County with nearby schools including Poplar Road Elementary School, East Coweta Middle School, and East Coweta High School.
Ownership History
Date
Name
Owned For
Owner Type
Purchase Details
Closed on
May 24, 2000
Sold by
Cox William G and Cox Jean R
Bought by
Cox Joseph J
Current Estimated Value
Home Financials for this Owner
Home Financials are based on the most recent Mortgage that was taken out on this home.
Original Mortgage
$166,056
Outstanding Balance
$57,367
Interest Rate
8.14%
Mortgage Type
FHA
Estimated Equity
$340,754
Purchase Details
Closed on
Jul 21, 1999
Sold by
Cox Jean R
Bought by
Cox William G
Home Financials for this Owner
Home Financials are based on the most recent Mortgage that was taken out on this home.
Original Mortgage
$157,500
Interest Rate
7.51%
Mortgage Type
New Conventional
Purchase Details
Closed on
Apr 30, 1993
Sold by
Cox William G and Cox Jean
Bought by
Cox Jean R
Purchase Details
Closed on
Nov 30, 1989
Sold by
Cox William G
Bought by
Cox William G and Cox Jean
Purchase Details
Closed on
Nov 30, 1986
Bought by
Cox William G
Create a Home Valuation Report for This Property
The Home Valuation Report is an in-depth analysis detailing your home's value as well as a comparison with similar homes in the area
Home Values in the Area
Average Home Value in this Area
Purchase History
| Date | Buyer | Sale Price | Title Company |
|---|---|---|---|
| Cox Joseph J | $167,000 | -- | |
| Cox William G | -- | -- | |
| Cox Jean R | -- | -- | |
| Cox William G | -- | -- | |
| Cox William G | -- | -- |
Source: Public Records
Mortgage History
| Date | Status | Borrower | Loan Amount |
|---|---|---|---|
| Open | Cox Joseph J | $166,056 | |
| Previous Owner | Cox William G | $157,500 |
Source: Public Records
Tax History Compared to Growth
Tax History
| Year | Tax Paid | Tax Assessment Tax Assessment Total Assessment is a certain percentage of the fair market value that is determined by local assessors to be the total taxable value of land and additions on the property. | Land | Improvement |
|---|---|---|---|---|
| 2025 | $2,600 | $110,029 | $37,372 | $72,657 |
| 2024 | $2,180 | $93,911 | $21,473 | $72,438 |
| 2023 | $2,180 | $85,371 | $21,670 | $63,701 |
| 2022 | $1,883 | $76,430 | $19,700 | $56,730 |
| 2021 | $1,794 | $68,150 | $18,762 | $49,388 |
| 2020 | $1,806 | $68,150 | $18,762 | $49,388 |
| 2019 | $1,907 | $65,167 | $18,404 | $46,763 |
| 2018 | $1,911 | $65,167 | $18,404 | $46,763 |
| 2017 | $1,910 | $65,167 | $18,404 | $46,763 |
| 2016 | $1,887 | $65,167 | $18,404 | $46,763 |
| 2015 | $1,855 | $65,167 | $18,404 | $46,763 |
| 2014 | $1,840 | $65,167 | $18,404 | $46,763 |
Source: Public Records
Map
Nearby Homes
- 2812 Highway 16 E
- 1948 Highway 16 E
- 2752 Poplar Rd
- 465 Little Rd
- 2784 Martin Mill Rd
- 0 Poplar Rd Unit 10580891
- 105 Turnberry Trace
- 65 Oakhurst Trail
- 69 Oakhurst Trail
- 108 Turnberry Trace
- 316 Winchester Dr
- 46 Lullwater Ct
- Bent Tree Court Lot: A-20
- 0 Bent Tree Ct Unit LOT A-20 10611800
- 68 Winchester Dr
- 25 Pacific Ave
- 565 Timberbrook Dr
- 0 Cannon Rd Unit 7627017
- 0 Cannon Rd Unit 10566028
- 9 Marvin Gardens
- 96 Brinley Dr Unit 15
- 78 Brinley Dr
- 110 Brinley Dr Unit LT14
- 136 Joe Cox Rd
- 120 Brinley Dr Unit 13
- 64 Brinley Dr Unit 17
- 83 Brinley Dr Unit LOT 4
- 2544 Highway 16 E
- 97 Brinley Dr Unit 5
- 69 Brinley Dr Unit 3
- 55 Brinley Dr Unit 2
- 39 Brinley Dr Unit 1
- 150 Joe Cox Rd
- 214 Joe Cox Rd
- 218 Joe Cox Rd
- 164 Brinley Dr Unit LT10
- 46 Joe Cox Rd
- 260 Joe Cox Rd
- 308 Joe Cox Rd
- 267 Joe Cox Rd