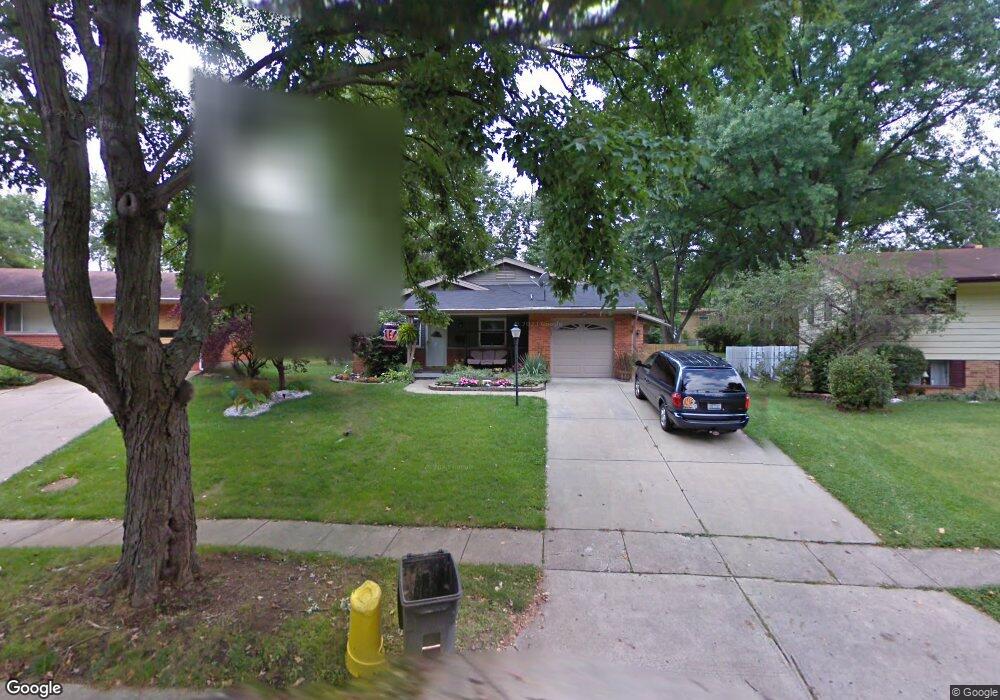
146 Junefield Ave Cincinnati, OH 45218
Estimated Value: $248,027 - $262,000
3
Beds
2
Baths
1,620
Sq Ft
$157/Sq Ft
Est. Value
About This Home
This home is located at 146 Junefield Ave, Cincinnati, OH 45218 and is currently estimated at $254,007, approximately $156 per square foot. 146 Junefield Ave is a home located in Hamilton County with nearby schools including Calvary Academy- The.
Ownership History
Date
Name
Owned For
Owner Type
Purchase Details
Closed on
Feb 24, 2023
Sold by
Ward Michael
Bought by
Ward Michael and Ward Rebecca
Current Estimated Value
Purchase Details
Closed on
Oct 29, 1998
Sold by
Morris Bobby Joe and Morris Sharon C
Bought by
Ward Michael
Home Financials for this Owner
Home Financials are based on the most recent Mortgage that was taken out on this home.
Original Mortgage
$100,200
Interest Rate
6.68%
Create a Home Valuation Report for This Property
The Home Valuation Report is an in-depth analysis detailing your home's value as well as a comparison with similar homes in the area
Home Values in the Area
Average Home Value in this Area
Purchase History
| Date | Buyer | Sale Price | Title Company |
|---|---|---|---|
| Ward Michael | $250 | None Listed On Document | |
| Ward Michael | $105,500 | -- |
Source: Public Records
Mortgage History
| Date | Status | Borrower | Loan Amount |
|---|---|---|---|
| Previous Owner | Ward Michael | $100,200 |
Source: Public Records
Tax History
| Year | Tax Paid | Tax Assessment Tax Assessment Total Assessment is a certain percentage of the fair market value that is determined by local assessors to be the total taxable value of land and additions on the property. | Land | Improvement |
|---|---|---|---|---|
| 2025 | $4,874 | $67,509 | $11,106 | $56,403 |
| 2024 | $4,493 | $67,509 | $11,106 | $56,403 |
| 2023 | $4,352 | $67,509 | $11,106 | $56,403 |
| 2022 | $4,024 | $46,691 | $8,621 | $38,070 |
| 2021 | $4,025 | $46,691 | $8,621 | $38,070 |
| 2020 | $3,979 | $46,691 | $8,621 | $38,070 |
| 2019 | $3,888 | $39,908 | $7,368 | $32,540 |
| 2018 | $3,894 | $39,908 | $7,368 | $32,540 |
| 2017 | $3,664 | $39,908 | $7,368 | $32,540 |
| 2016 | $4,065 | $42,805 | $7,959 | $34,846 |
| 2015 | $3,776 | $42,805 | $7,959 | $34,846 |
| 2014 | $3,858 | $42,805 | $7,959 | $34,846 |
| 2013 | $4,079 | $46,529 | $8,652 | $37,877 |
Source: Public Records
Map
Nearby Homes
- 16 Japonica Dr
- 1 Jennings Rd
- 38 Handel Ln
- 34 Gambier Cir
- 29 Dayspring Terrace
- 37 Hayden Dr
- 31 Flanders Ln
- 11 Dewitt Ct
- 1105 Inner Circle Dr
- 9 Dewitt Ct
- 7 Dewitt Ct
- 6 Chalmers Ct
- 48 Damon Rd
- 920 Waycross Rd
- 1013 Ligorio Ave
- 602 Brightview Place Unit 34
- 612 Brightview Place Unit 30
- 614 Brightview Place Unit 29
- 626 Brightview Place Unit 24
- 622 Brightview Place Unit 26
Your Personal Tour Guide
Ask me questions while you tour the home.