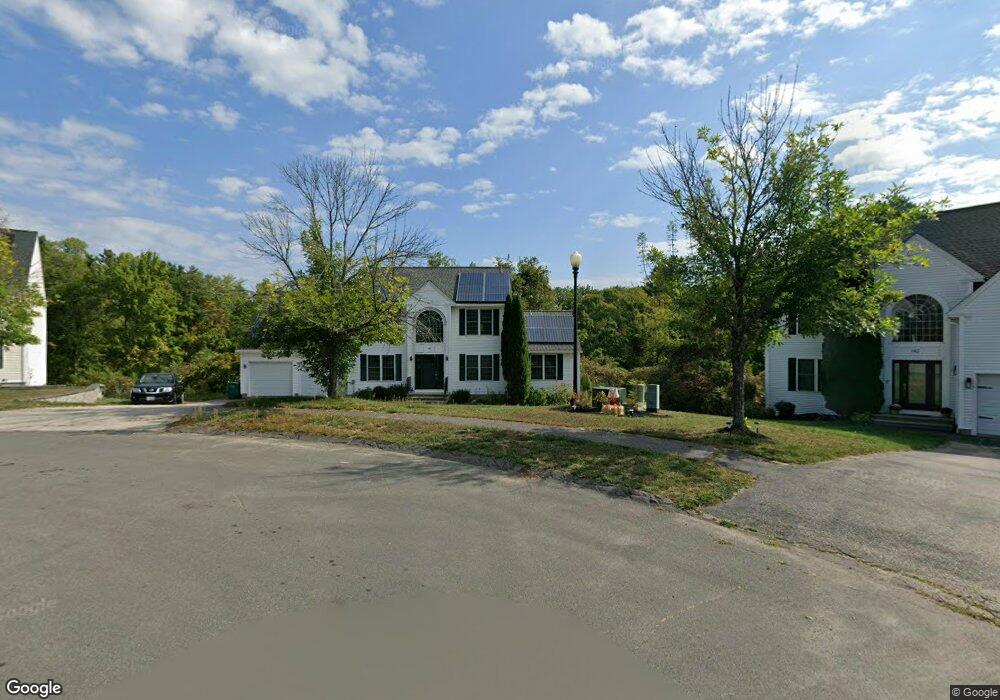
146 Macintosh Ln Fitchburg, MA 01420
Estimated Value: $628,619 - $730,000
4
Beds
3
Baths
2,560
Sq Ft
$264/Sq Ft
Est. Value
About This Home
This home is located at 146 Macintosh Ln, Fitchburg, MA 01420 and is currently estimated at $676,905, approximately $264 per square foot. 146 Macintosh Ln is a home located in Worcester County with nearby schools including Crocker Elementary School, South Street Elementary School, and Fitchburg High School.
Ownership History
Date
Name
Owned For
Owner Type
Purchase Details
Closed on
Jan 4, 2017
Sold by
Lesperance Christopher J and Lesperance Elizabeth M
Bought by
Lesperance Christopher J and Lesperance Elizabeth M
Current Estimated Value
Home Financials for this Owner
Home Financials are based on the most recent Mortgage that was taken out on this home.
Original Mortgage
$253,280
Outstanding Balance
$39,938
Interest Rate
4.03%
Mortgage Type
New Conventional
Estimated Equity
$636,967
Purchase Details
Closed on
Aug 21, 2009
Sold by
Donahue Joseph P and Donahue Monique D
Bought by
Lesperance Christopher J and Karsok Elizabeth M
Home Financials for this Owner
Home Financials are based on the most recent Mortgage that was taken out on this home.
Original Mortgage
$310,766
Interest Rate
5.19%
Mortgage Type
Purchase Money Mortgage
Purchase Details
Closed on
May 26, 2004
Sold by
New England Colonial H
Bought by
Donahue Joseph P and Donahue Monique D
Home Financials for this Owner
Home Financials are based on the most recent Mortgage that was taken out on this home.
Original Mortgage
$254,000
Interest Rate
5.88%
Mortgage Type
Purchase Money Mortgage
Create a Home Valuation Report for This Property
The Home Valuation Report is an in-depth analysis detailing your home's value as well as a comparison with similar homes in the area
Home Values in the Area
Average Home Value in this Area
Purchase History
| Date | Buyer | Sale Price | Title Company |
|---|---|---|---|
| Lesperance Christopher J | -- | -- | |
| Lesperance Christopher J | $316,500 | -- | |
| Donahue Joseph P | $373,900 | -- |
Source: Public Records
Mortgage History
| Date | Status | Borrower | Loan Amount |
|---|---|---|---|
| Open | Lesperance Christopher J | $253,280 | |
| Previous Owner | Lesperance Christopher J | $310,766 | |
| Previous Owner | Donahue Joseph P | $254,000 | |
| Previous Owner | Donahue Joseph P | $56,500 |
Source: Public Records
Tax History Compared to Growth
Tax History
| Year | Tax Paid | Tax Assessment Tax Assessment Total Assessment is a certain percentage of the fair market value that is determined by local assessors to be the total taxable value of land and additions on the property. | Land | Improvement |
|---|---|---|---|---|
| 2025 | $72 | $536,200 | $124,600 | $411,600 |
| 2024 | $7,441 | $502,400 | $100,200 | $402,200 |
| 2023 | $7,336 | $457,900 | $89,600 | $368,300 |
| 2022 | $7,099 | $403,100 | $87,900 | $315,200 |
| 2021 | $7,163 | $376,400 | $84,900 | $291,500 |
| 2020 | $6,845 | $347,300 | $83,400 | $263,900 |
| 2019 | $6,583 | $321,300 | $84,800 | $236,500 |
| 2018 | $6,328 | $301,200 | $78,800 | $222,400 |
| 2017 | $6,077 | $282,800 | $77,300 | $205,500 |
| 2016 | $5,688 | $267,900 | $71,300 | $196,600 |
| 2015 | $5,457 | $263,900 | $68,300 | $195,600 |
| 2014 | $5,233 | $263,900 | $68,300 | $195,600 |
Source: Public Records
Map
Nearby Homes
- 665 Townsend St
- 1083 Northfield Rd
- 840 Fisher Rd
- 474 Townsend St
- 340 New West Townsend Rd
- 23 Tilton Ave
- 15 White St
- 518 North St
- 344 Pearl Hill Rd
- 36 Will Thompson Way
- 855 John Fitch Hwy Unit 44
- 332-336 Lunenburg St
- 9 Pleasant St
- 276 Lunenburg St Unit 50
- 276 Lunenburg St Unit 66
- 363 Lunenburg St
- 288-290 Pearl St
- 77 Electric Ave
- 756 Northfield Rd
- 74 East St
- 142 Macintosh Ln
- 142 Macintosh Ln Unit 142
- 149 Macintosh Ln
- 132 Macintosh Ln
- 143 Macintosh Ln
- 139 Macintosh Ln
- 129 Macintosh Ln
- 122 Macintosh Ln
- 112 Macintosh Ln
- 55 New West Townsend Rd
- 41 New West Townsend Rd
- 119 Macintosh Ln
- 102 Macintosh Ln
- 21 New West Townsend Rd
- 6 New West Townsend Rd
- 6 New West Townsend Rd
- 6 New West Townsend Rd
- 71 New West Townsend Rd
- 85 New West Townsend Rd
- 99 Macintosh Ln