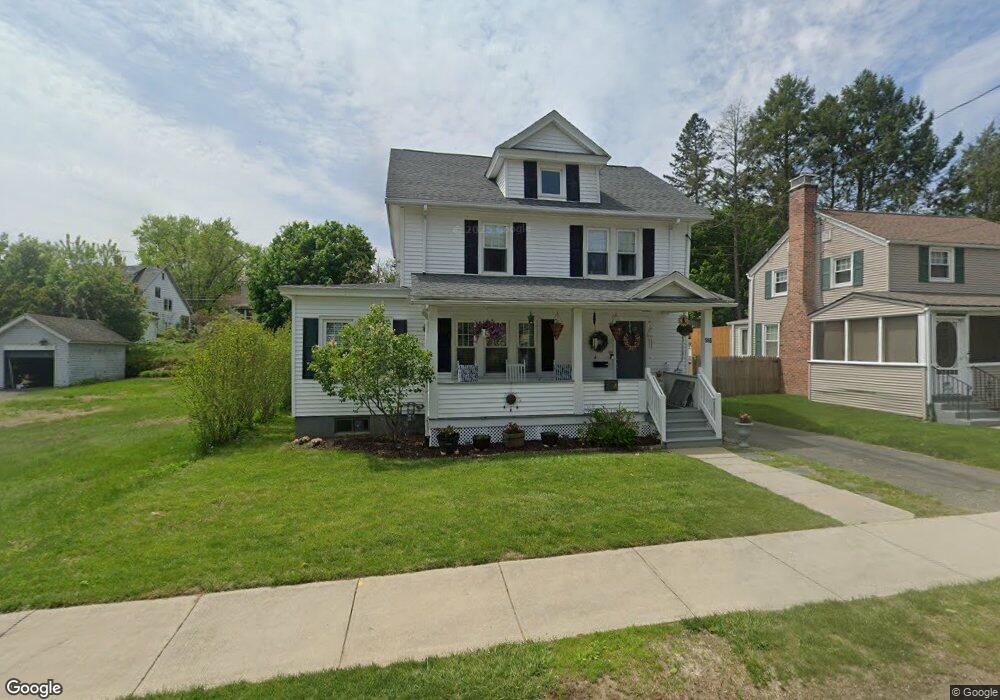
146 Nelson St West Springfield, MA 01089
Estimated Value: $297,000 - $355,000
3
Beds
2
Baths
1,558
Sq Ft
$215/Sq Ft
Est. Value
About This Home
This home is located at 146 Nelson St, West Springfield, MA 01089 and is currently estimated at $335,237, approximately $215 per square foot. 146 Nelson St is a home located in Hampden County with nearby schools including St Thomas The Apostle School.
Ownership History
Date
Name
Owned For
Owner Type
Purchase Details
Closed on
Nov 6, 2018
Sold by
Aad Llc
Bought by
Cig 4 Llc
Current Estimated Value
Home Financials for this Owner
Home Financials are based on the most recent Mortgage that was taken out on this home.
Original Mortgage
$152,175
Outstanding Balance
$133,257
Interest Rate
4.6%
Mortgage Type
New Conventional
Estimated Equity
$201,980
Purchase Details
Closed on
Jul 27, 2007
Sold by
Tesny John S and Rochon Karen A
Bought by
Kenary Megan J and Kenary Ryan
Home Financials for this Owner
Home Financials are based on the most recent Mortgage that was taken out on this home.
Original Mortgage
$185,000
Interest Rate
6.78%
Mortgage Type
Purchase Money Mortgage
Create a Home Valuation Report for This Property
The Home Valuation Report is an in-depth analysis detailing your home's value as well as a comparison with similar homes in the area
Home Values in the Area
Average Home Value in this Area
Purchase History
| Date | Buyer | Sale Price | Title Company |
|---|---|---|---|
| Cig 4 Llc | $152,000 | -- | |
| Kenary Megan J | $195,000 | -- |
Source: Public Records
Mortgage History
| Date | Status | Borrower | Loan Amount |
|---|---|---|---|
| Open | Cig 4 Llc | $152,175 | |
| Previous Owner | Kenary Megan J | $185,000 |
Source: Public Records
Tax History Compared to Growth
Tax History
| Year | Tax Paid | Tax Assessment Tax Assessment Total Assessment is a certain percentage of the fair market value that is determined by local assessors to be the total taxable value of land and additions on the property. | Land | Improvement |
|---|---|---|---|---|
| 2025 | $4,587 | $308,500 | $106,200 | $202,300 |
| 2024 | $4,172 | $281,700 | $106,200 | $175,500 |
| 2023 | $3,972 | $255,600 | $106,200 | $149,400 |
| 2022 | $3,600 | $228,400 | $96,400 | $132,000 |
| 2021 | $3,639 | $215,300 | $87,800 | $127,500 |
| 2020 | $3,604 | $212,100 | $87,800 | $124,300 |
| 2019 | $3,597 | $212,100 | $87,800 | $124,300 |
| 2018 | $3,245 | $190,300 | $87,800 | $102,500 |
| 2017 | $3,245 | $190,300 | $87,800 | $102,500 |
| 2016 | $3,175 | $186,900 | $84,400 | $102,500 |
| 2015 | $3,116 | $183,400 | $82,800 | $100,600 |
| 2014 | $756 | $183,400 | $82,800 | $100,600 |
Source: Public Records
Map
Nearby Homes
- 146 Nelson St
- 146 Nelson St Unit 1
- 142 Nelson St
- 156 Nelson St
- 136 Nelson St
- 143 Wilder Terrace
- 135 Wilder Terrace
- 145 Wilder Terrace
- 153 Wilder Terrace
- 131 Wilder Terrace
- 143 Nelson St
- 149 Nelson St
- 166 Nelson St
- 159 Nelson St
- 157 Wilder Terrace
- 128 Nelson St
- 121 Wilder Terrace
- 131 Nelson St
- 165 Nelson St
- 129 Nelson St